Edit parameters Sphere: Energy 10.0 keV Flux 1.00E+12 ph/s Exposure 1.00 s Concentration 4.00 mg/ml
Scattering Profile 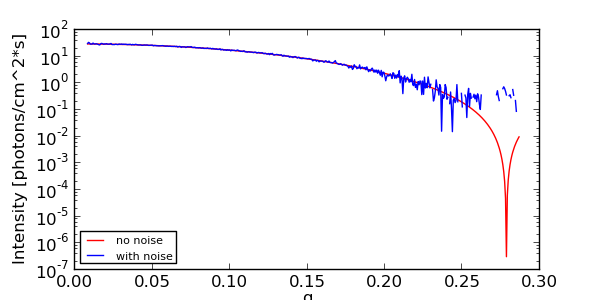
|
Guinier Analysis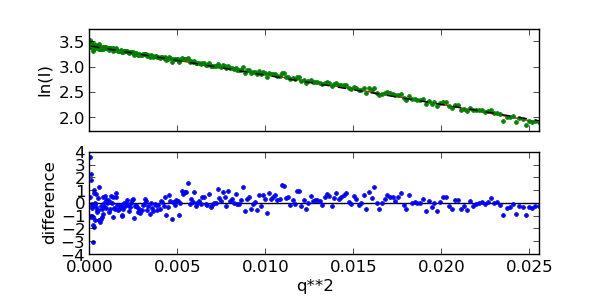
| ||||||||||
|---|---|---|---|---|---|---|---|---|---|---|---|
Kratky Plot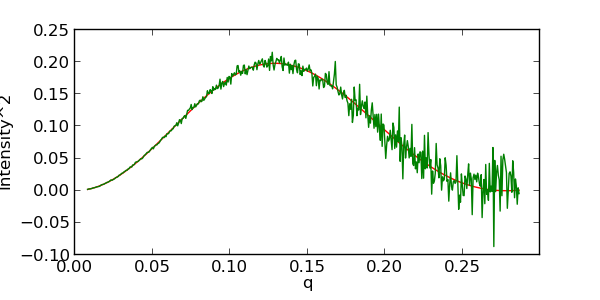
|
Simulation parameters and results:
Notes: Profiles are most accurate between 1.5 keV and 20 keV. This example mimics CHESS G1 station when using 25 um mica windows with sample path 1.5 mm. Calculations can be slow for large detectors. Beam is centered on the lower detector edge. Quantum efficiency corresponds to 320 um silicon sensor thickness. Buffer settings are ignored at the moment. The buffer model (0.15M NaCl in water) currently limits calculations to q < 0.8A. RNA and DNA settings are also ignored in this implementation. "Sim. Rg. (with noise)" is based on qmax*Rg = 1.3. |
Download profile (.dat format)