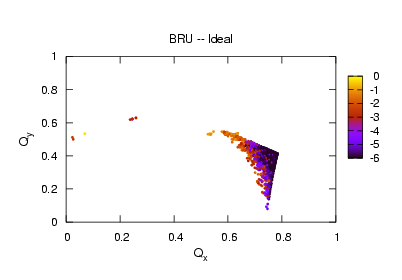
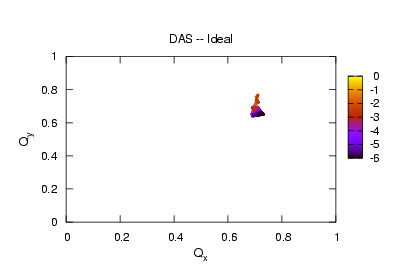
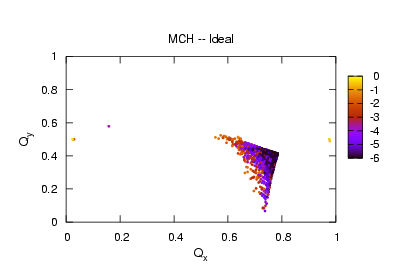
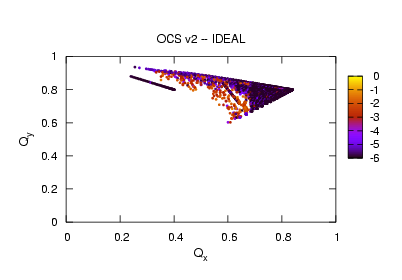
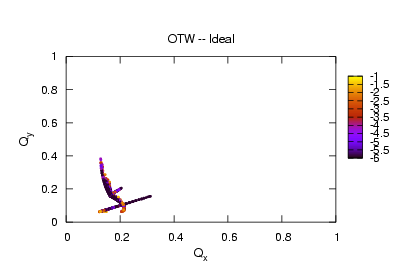
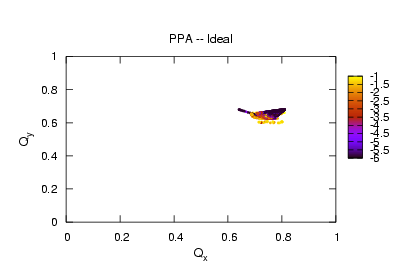
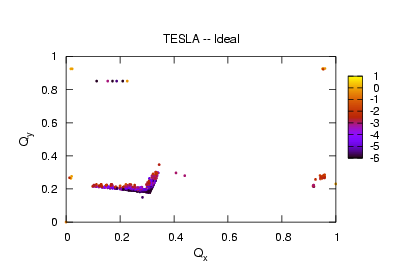
Frequency Map Analysis performed for single particles started at range of initial amplitudes throughout the dynamic aperture. Particles tracked for at least one damping time. Point is plotted at value of horizontal and vertical tune after 1/2 damping time. Color of point is Log10 of quadratic sum of change in vertical tune from 1st half to 2nd half of damping time and change in horizontal tune from 1st half to 2nd half. Using ideal non-linear wiggler model.
|
|
|
|---|---|
|
|
|
|
|
|
|
|
Return to Main
Created June 7, 2005
Modified July 7, 2005