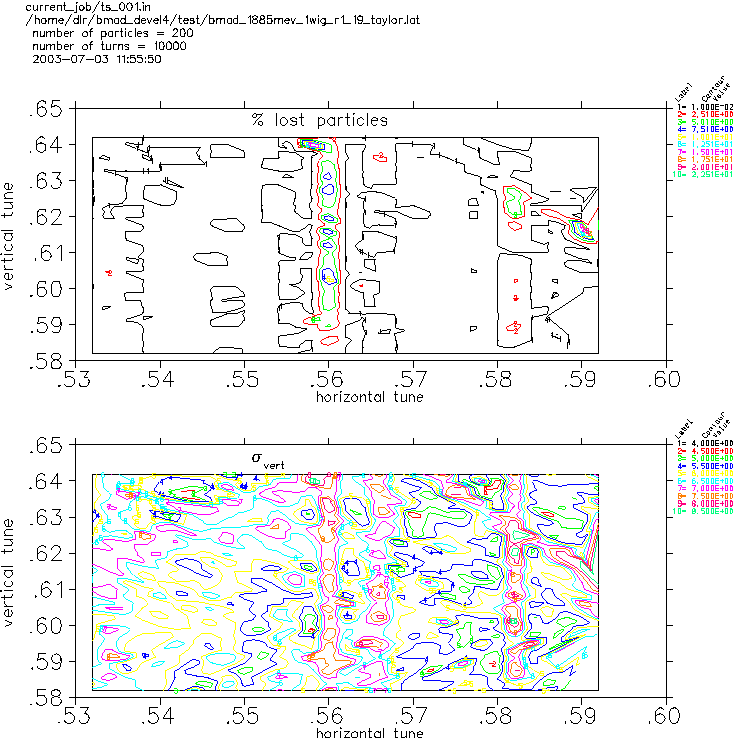
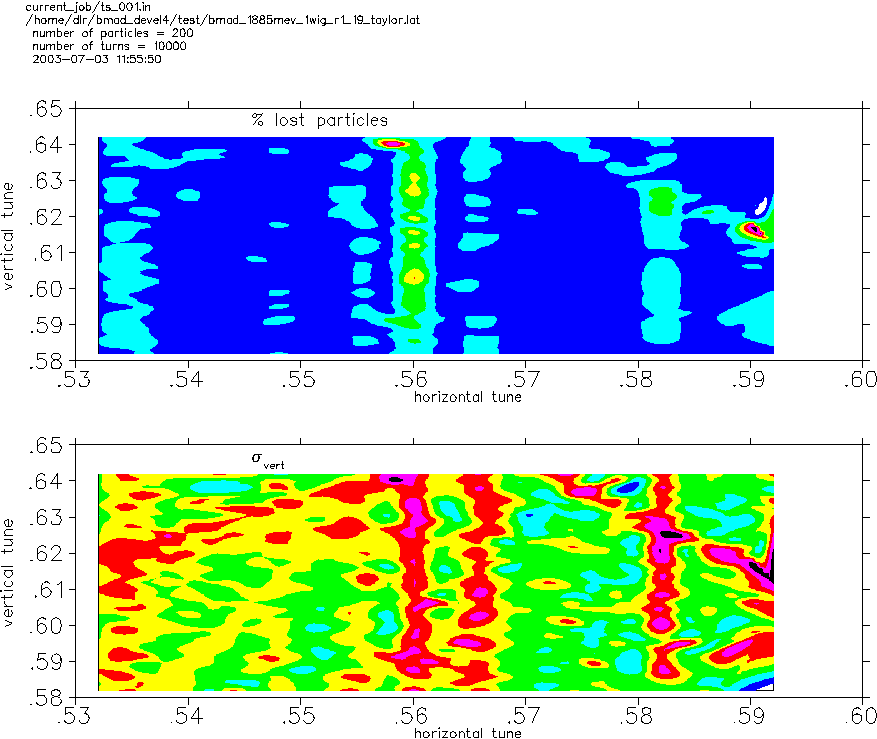
Initial distribution of strong beam is gaussian in x,y,z based on computed
coupling parameters with 1% minimum x-y coupling. Initial distribution
of weak beam assumes no minimum coupling. Final/initial rms vertical size
of weak beam (200 particles) is shown in lower plot labelled sigma_vert. The upper plot shows
the percentage of the particles in the initial distribution of the weak
beam that do not survive the 10000 turns.
The two pairs of graphs plot the same data. The upper pair uses the PHYSICA contour
command. The lower pair uses the PHYSICA density command