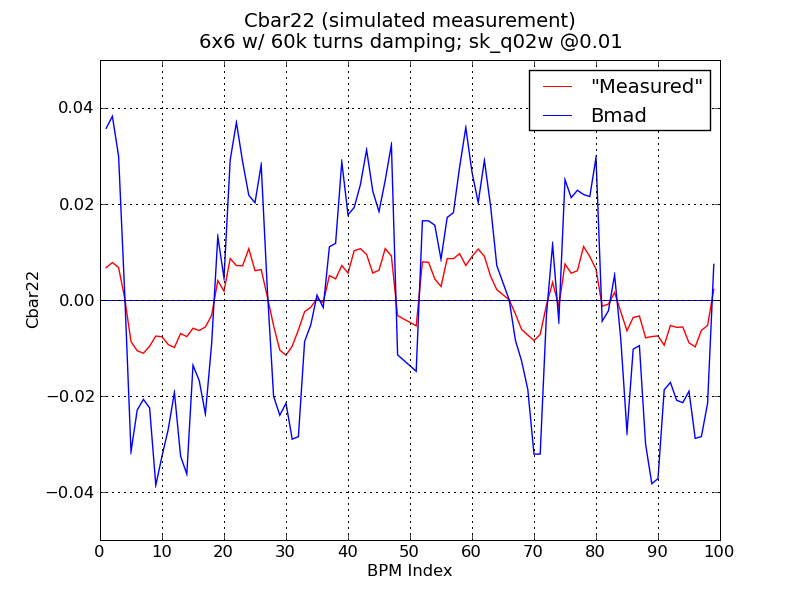
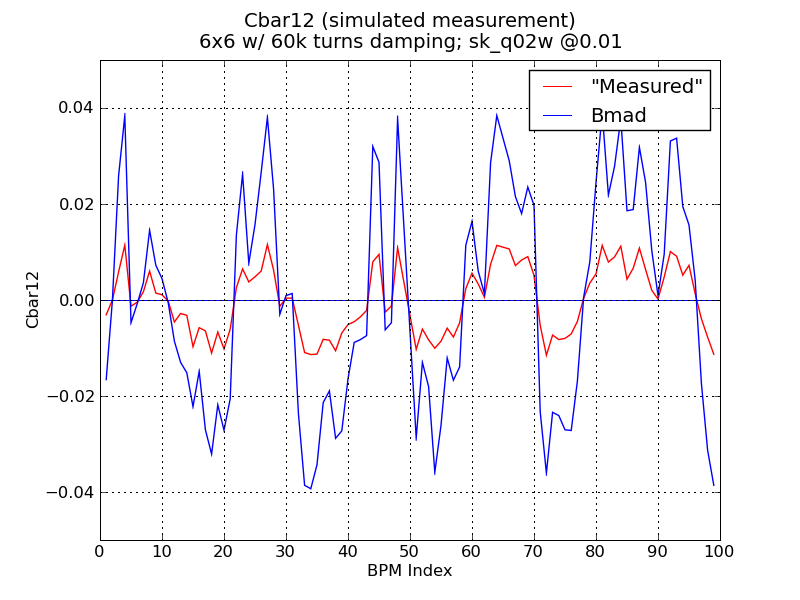
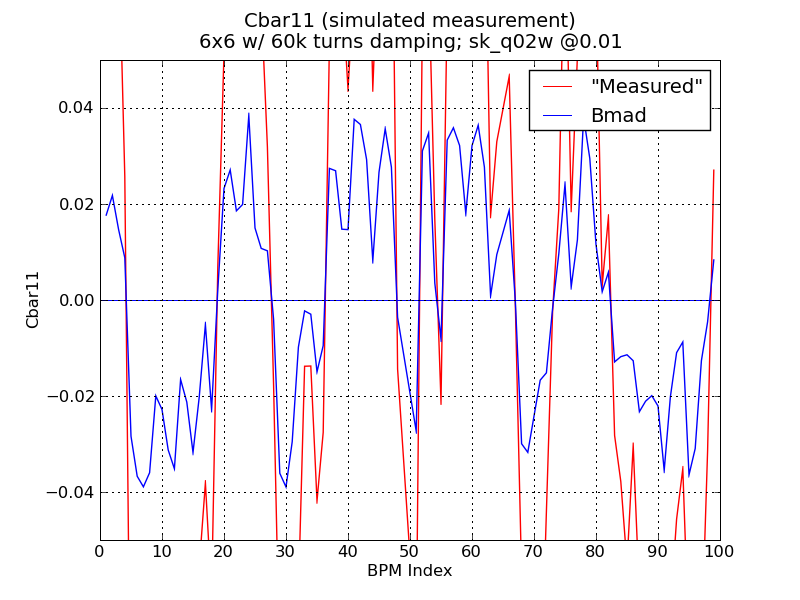
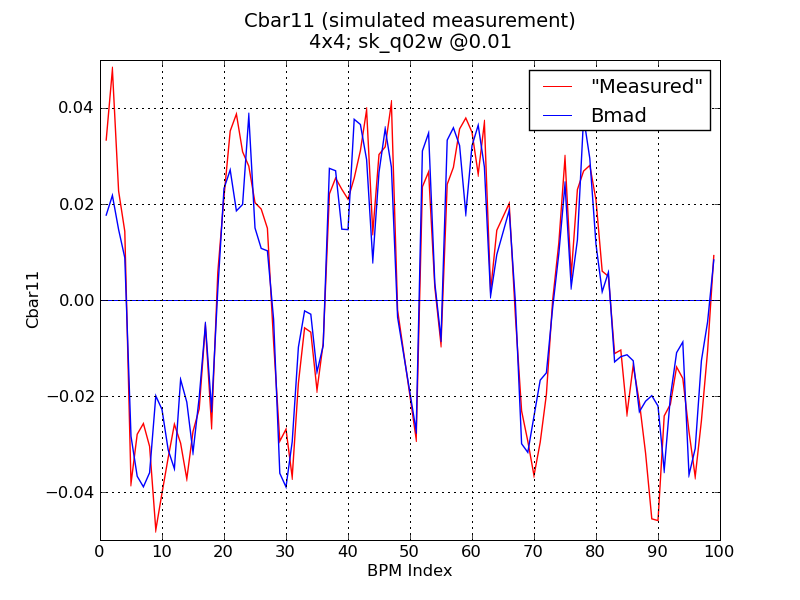
Similar to previous studies in Cbar measurement simulation, now turn on radiation damping and RF cavities. Instead of off setting the initial coordinate of the particle, now we resonantly excite at the a- and b-mode tunes. For the purposes of this exercise, take the origins of shaking to be at H01W (element #4 in the lattice) and V02W (element #43). Damp for 60k turns and record 1024 turns. Start with an ideal lattice (cta_2085mev_20090516.lat; no errors or resolution, w/ sk_q02W @0.01) and look at the difference between "measured" and Bmad model Cbar values.
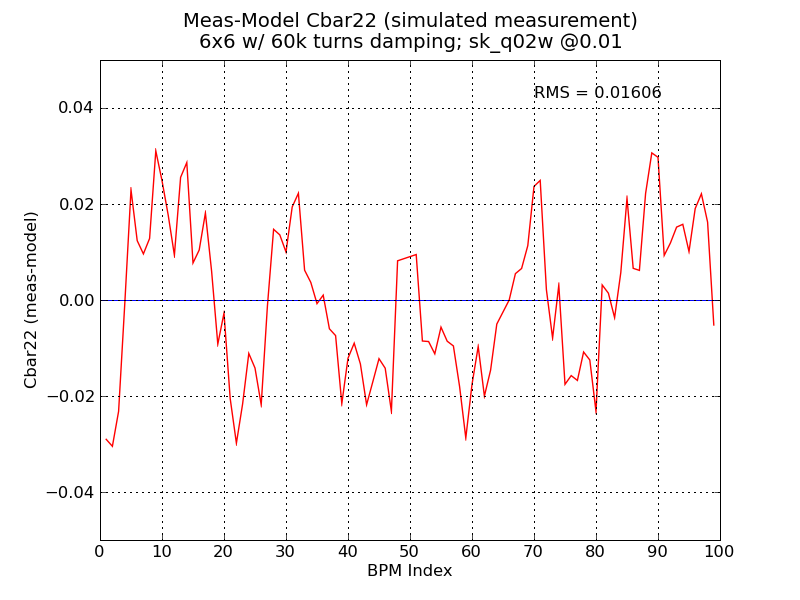
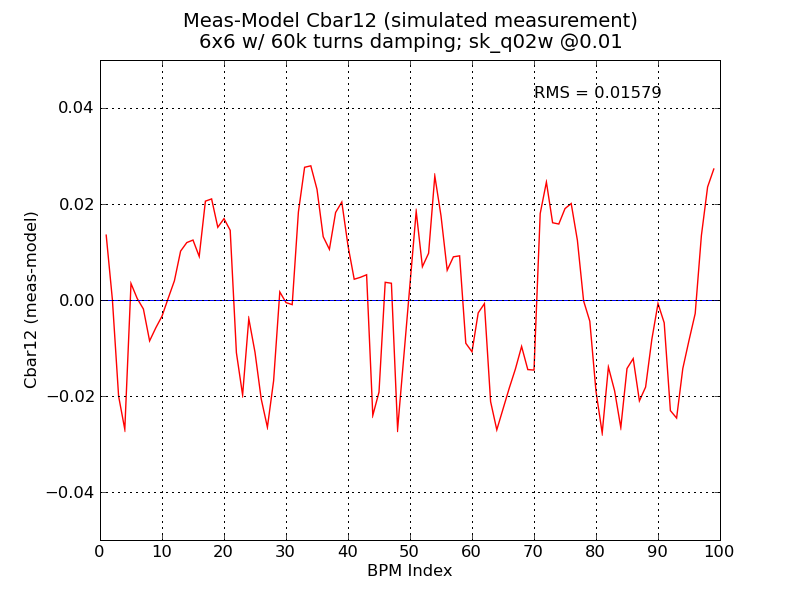
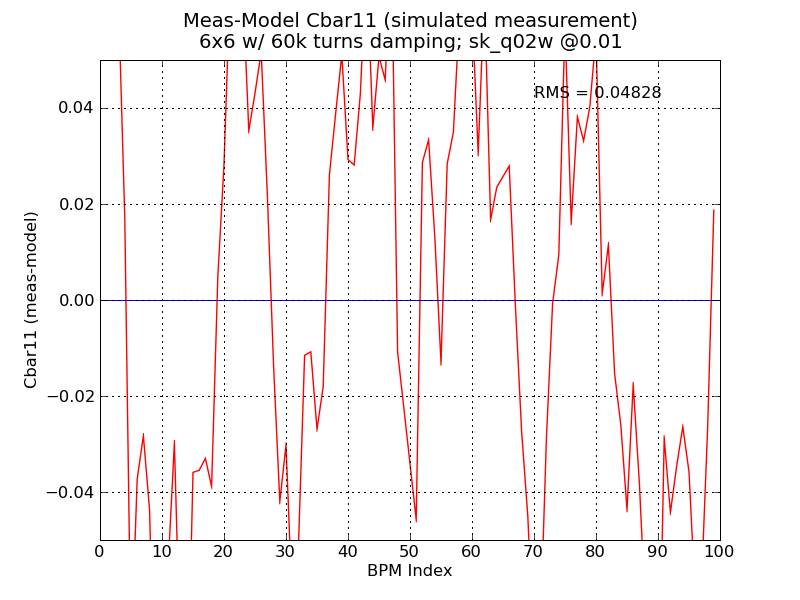
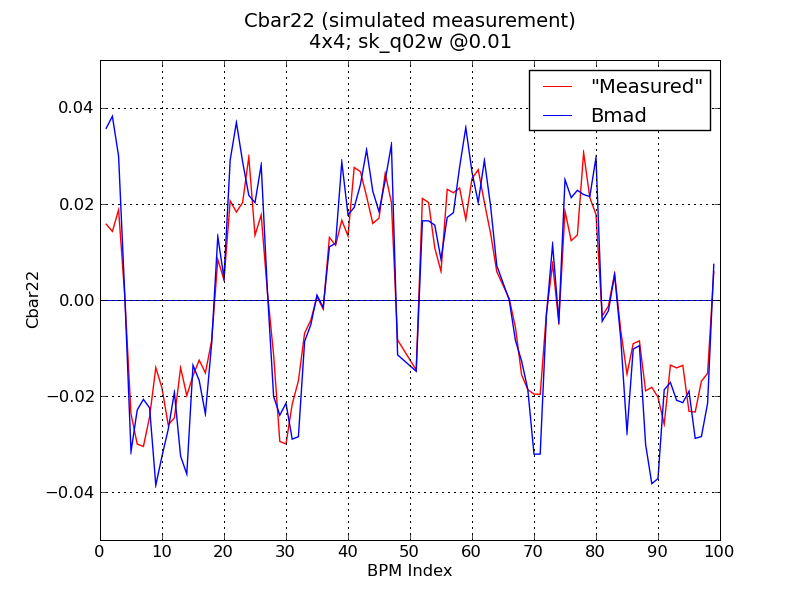
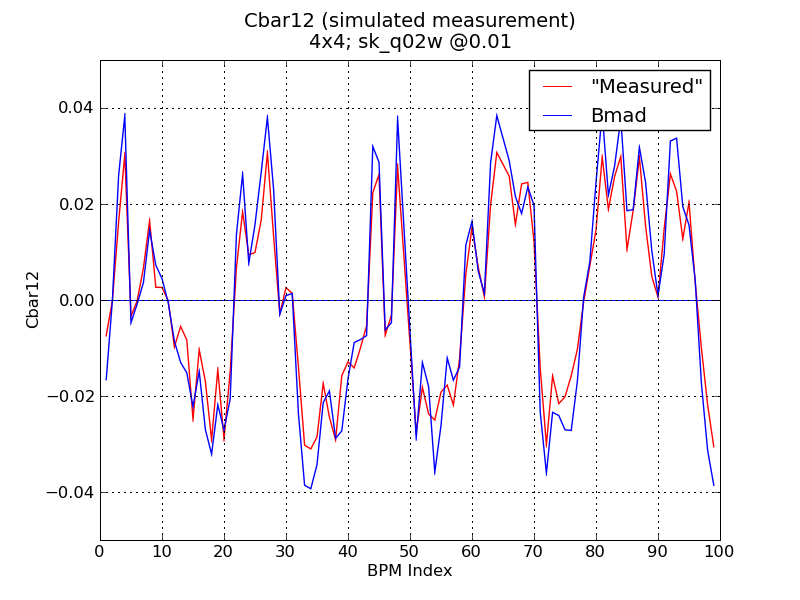
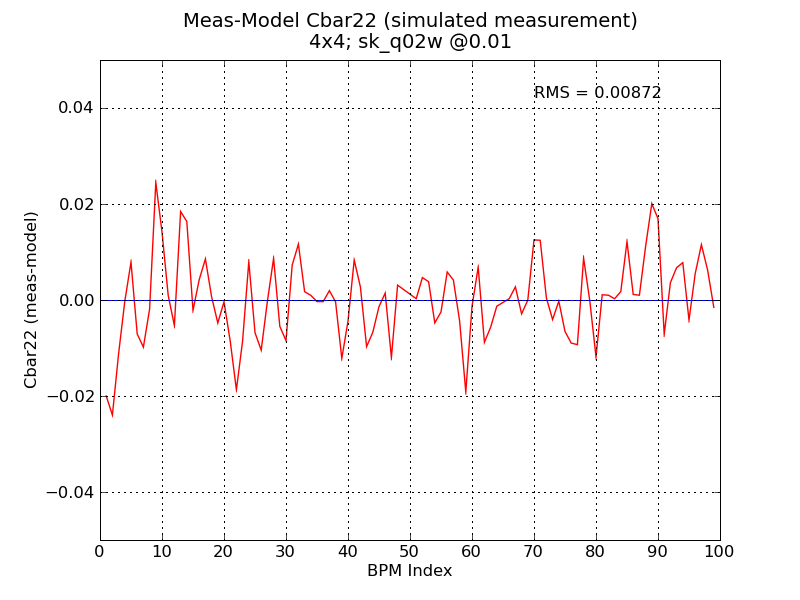
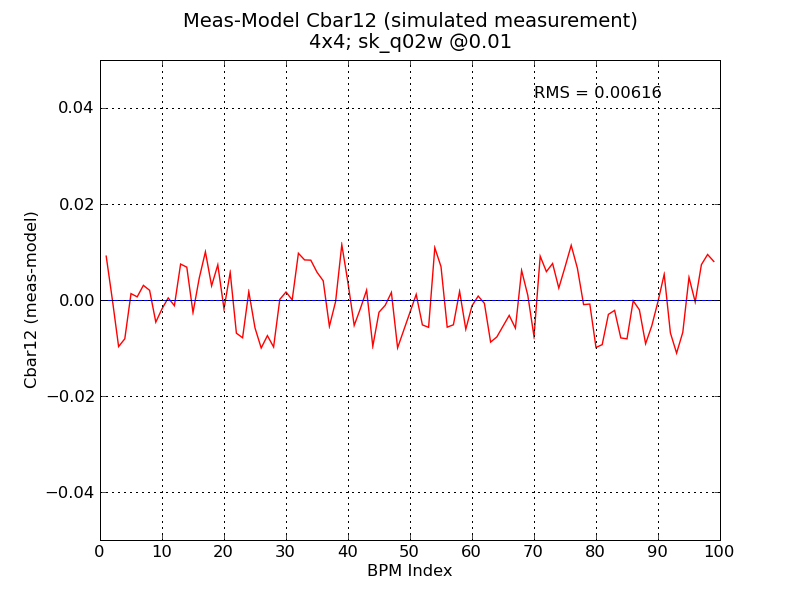
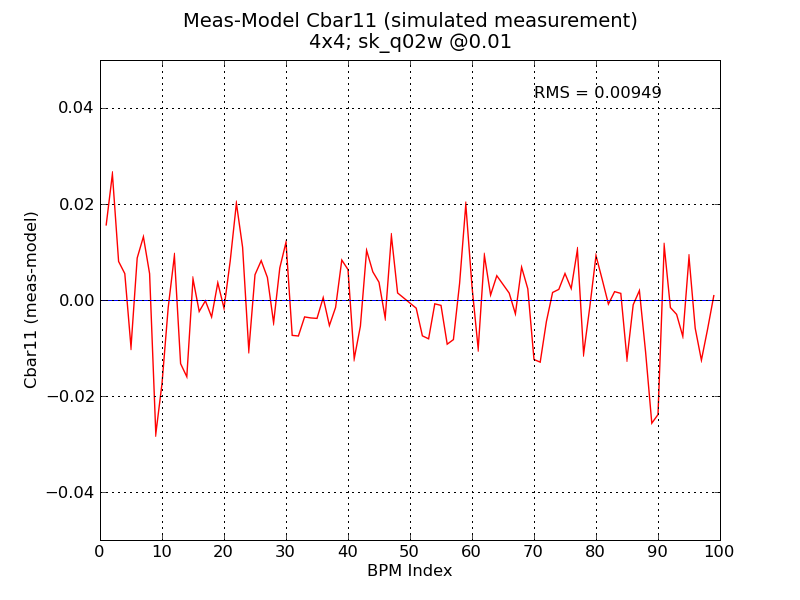
The resulting RMS Cbar values are very large. This is after correcting code errors that caused RMS values to appear larger after 60k turns damping than if the first 1024 turns were sampled. Compare the above plots to 4x4 tracking for an identical scenario (but sampling the first 1024 turns, not waiting 60k turns):
Using the same setup (sk_q02w @0.01, but otherwise an ideal lattice), analyze the turn-by-turn "data" at BPM 9W. (exact BPM number is arbitrary, any other BPM would do) Take the FFT of the orbit data and see if the tunes are where we expect them. Do this for 4x4 and 6x6 tracking. For 6x6, take both the first 1024 turns and after 60k turns of damping.
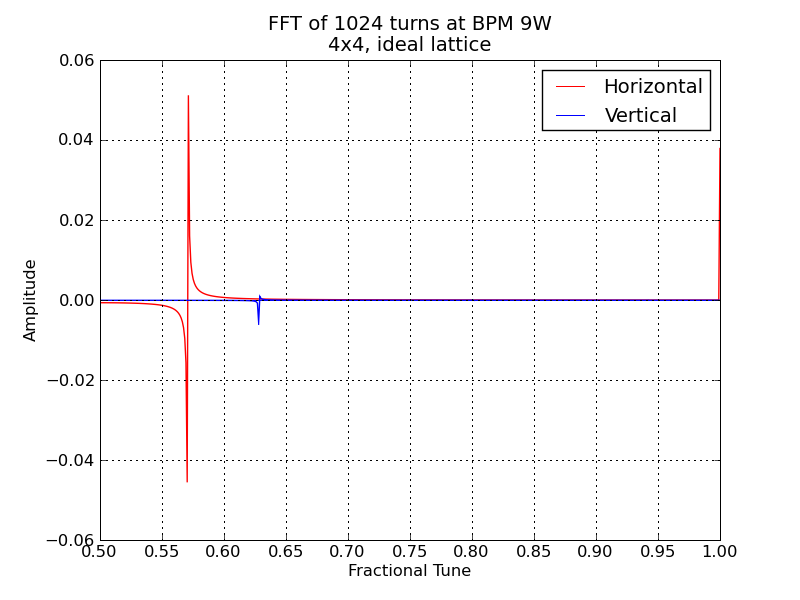
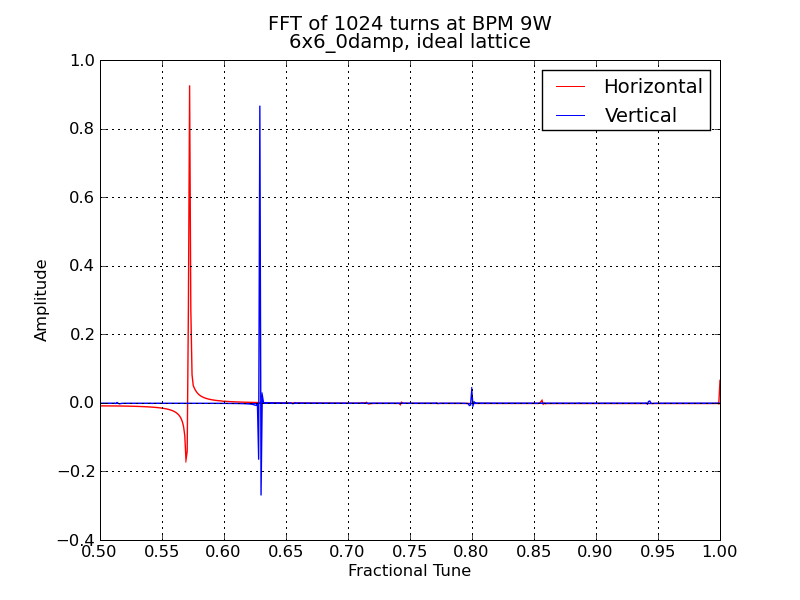
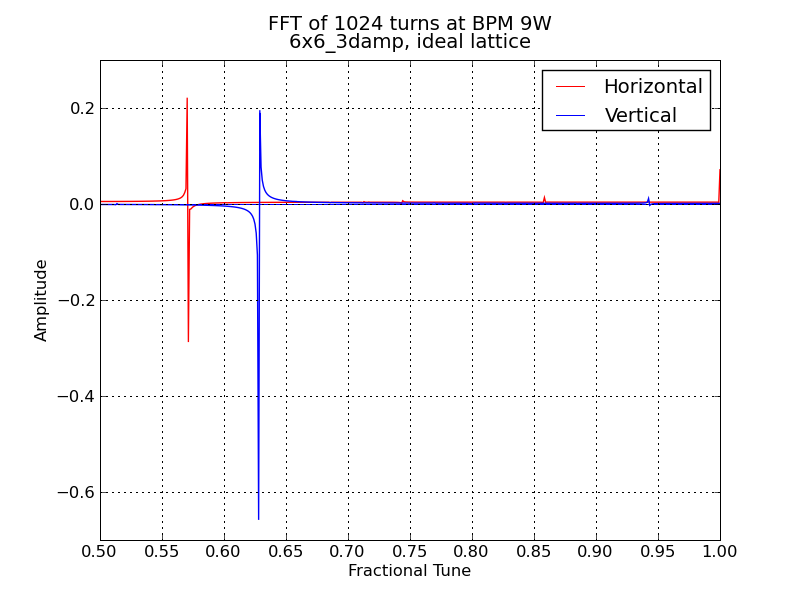
Note that these FFT plots are actually (1-FFT), because the actual FFT samples [0:0.5]. Recall the design tunes are: Qx = 0.5708, Qy = 0.6281.