
Two rather major typos in the "sim_cbar" program have been corrected. The first involves which amplitudes are used to calculate the Cbar elements-- the "a-mode in y" and "b-mode in x" amplitudes were reversed. Secondly, the amplitudes should have been normalized by 1/sqrt(beta) all along. By correcting both these sets of typos, results have improved by roughly a factor of 2. As a result, we must re-run many of the previous jobs.
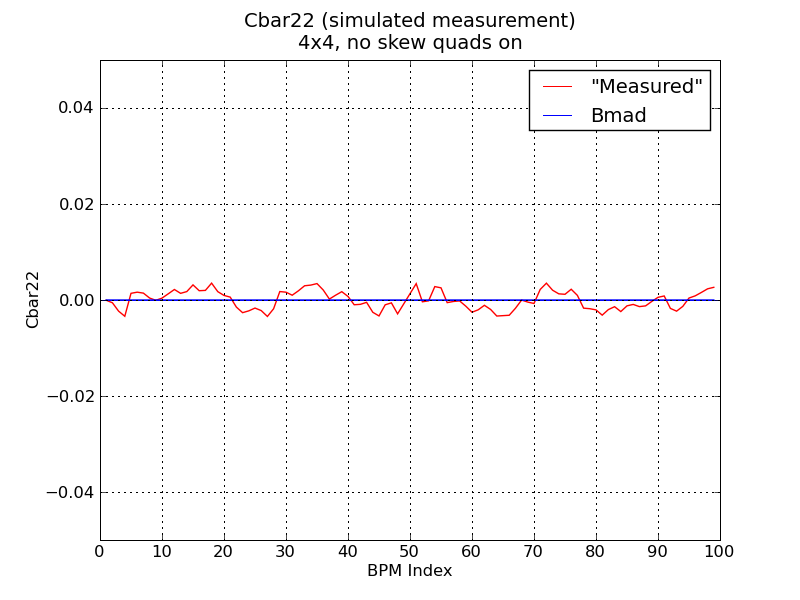
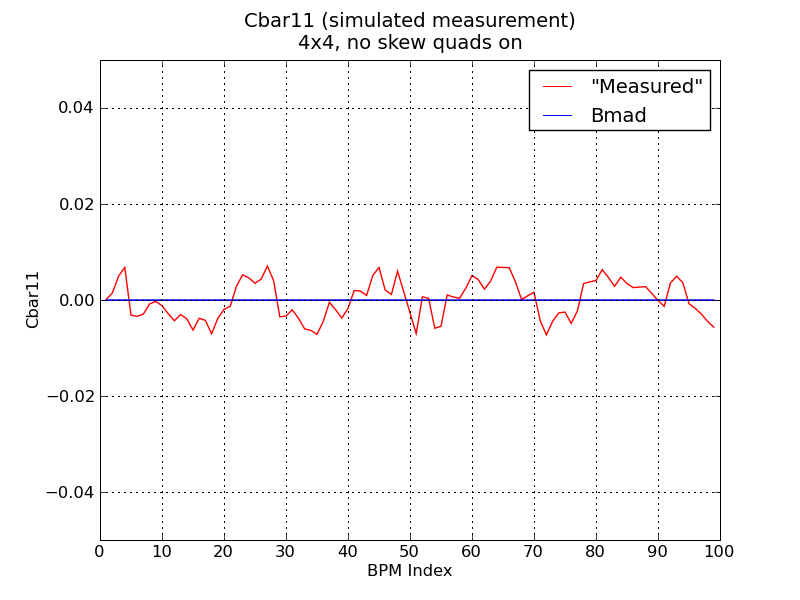
To confirm the new results make sense, run a simple set of jobs with no errors/misalignments, sampling 1024 turns, and damping for 40k turns for 6x6 tracking. Plot the 'measured' and Bmad Cbars together. First 4x4 tracking w/o skew quads:
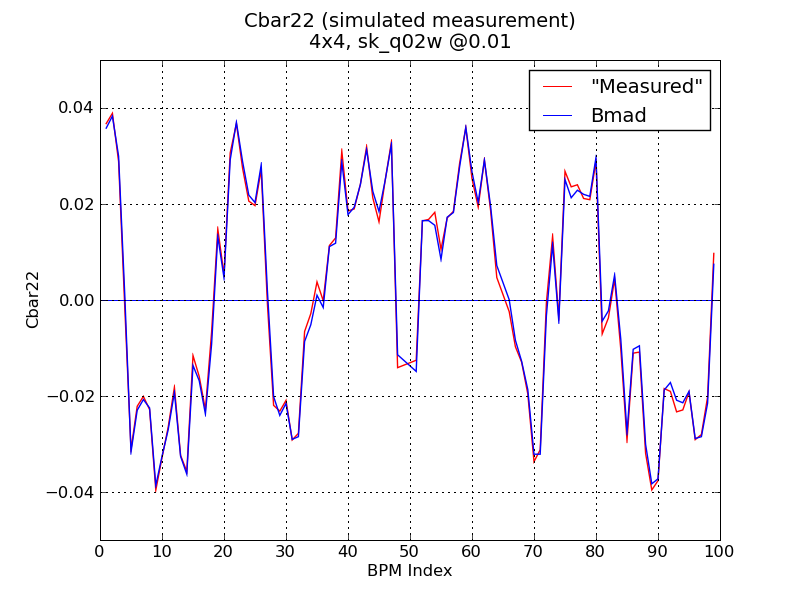
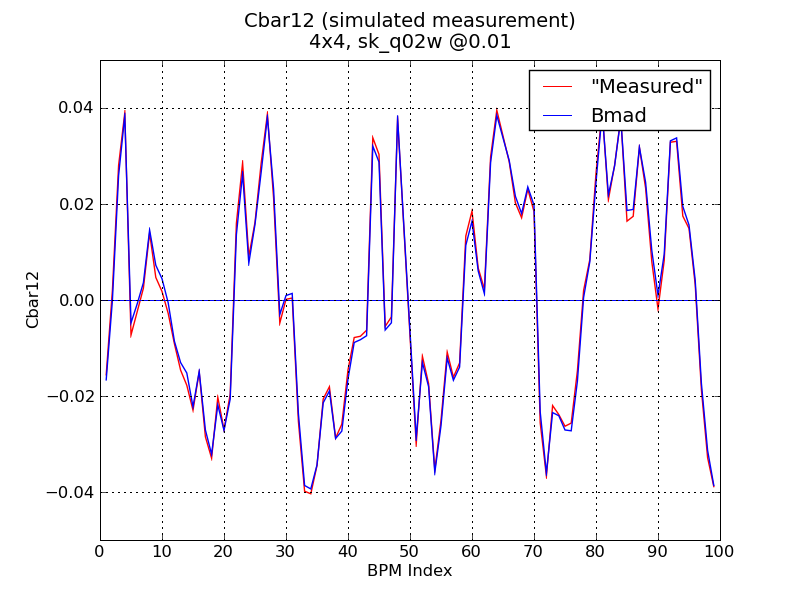
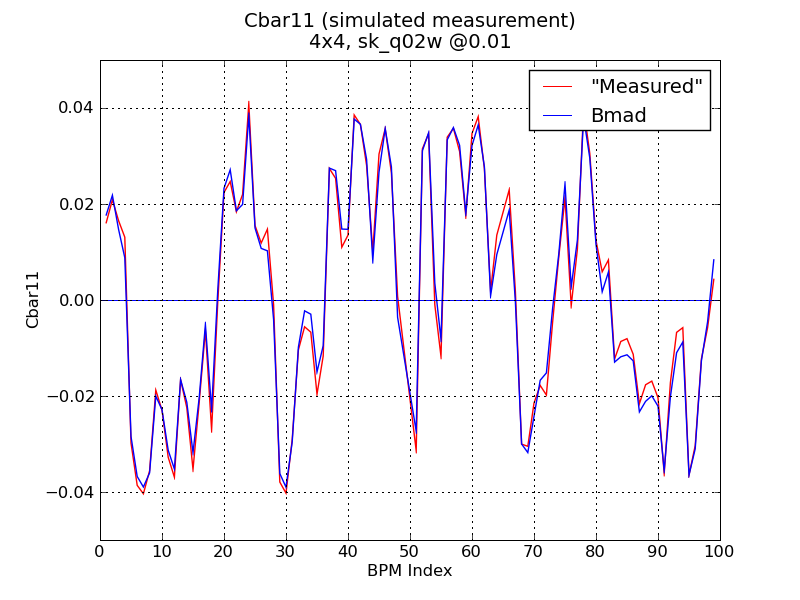
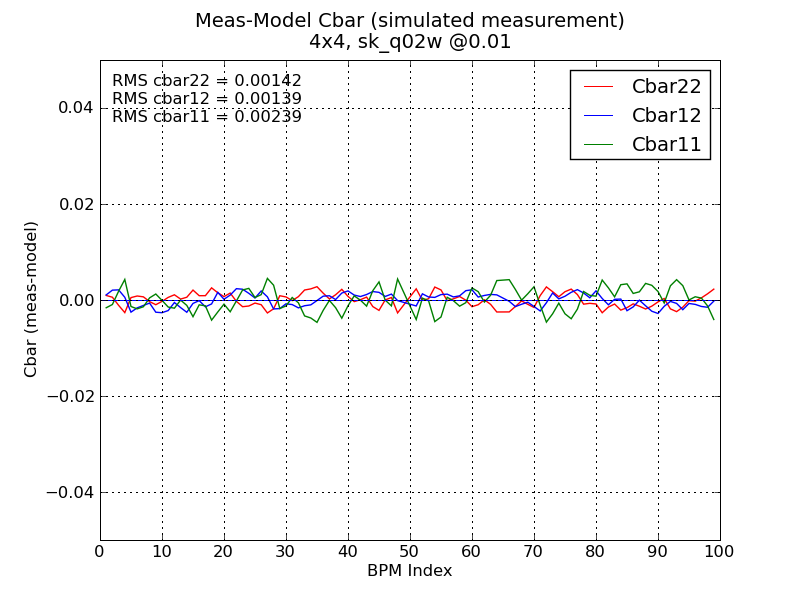
4x4 tracking with sk_q02w @0.01:
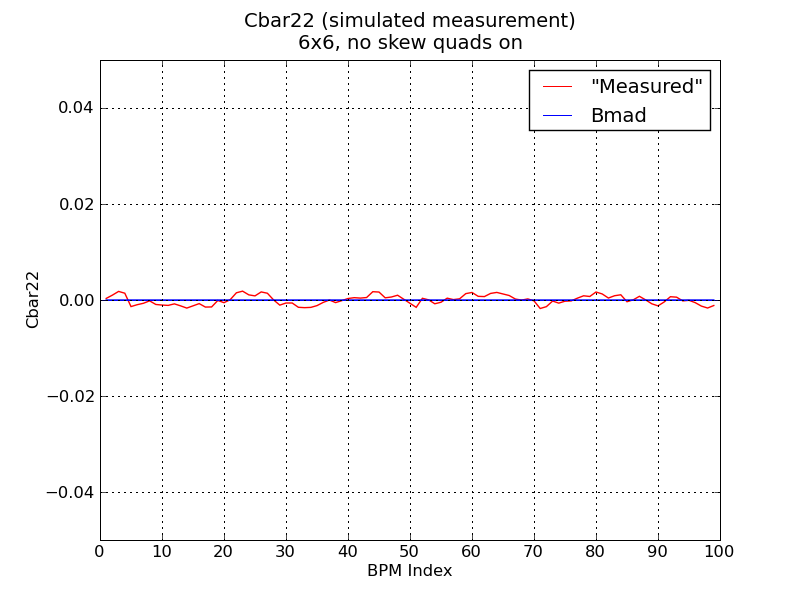
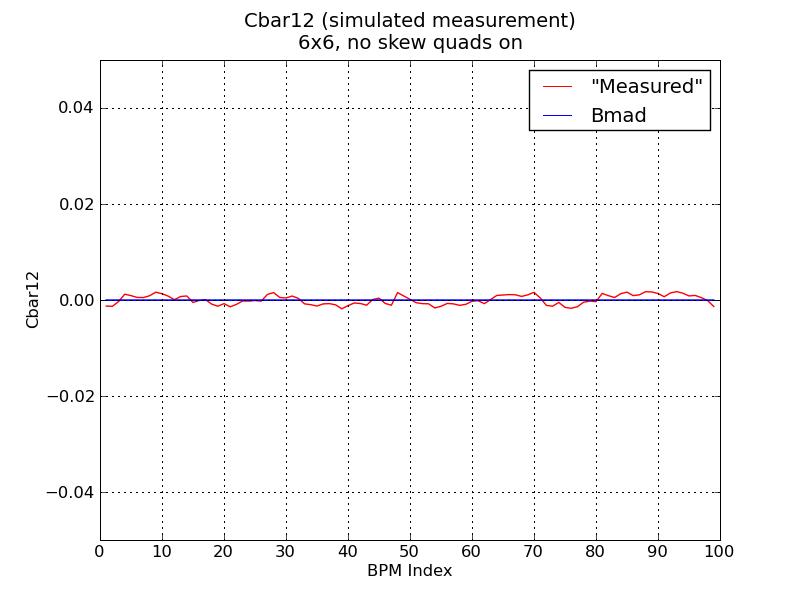
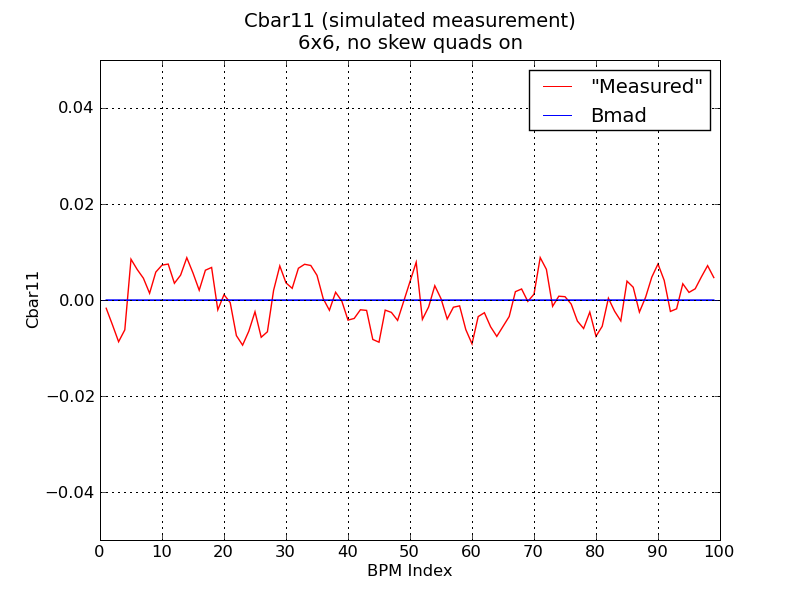
6x6 tracking w/o skew quads:
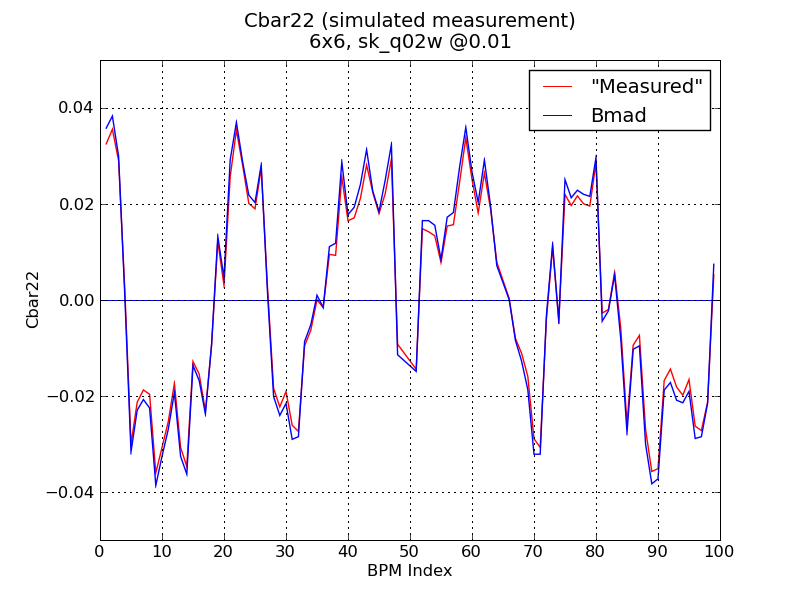
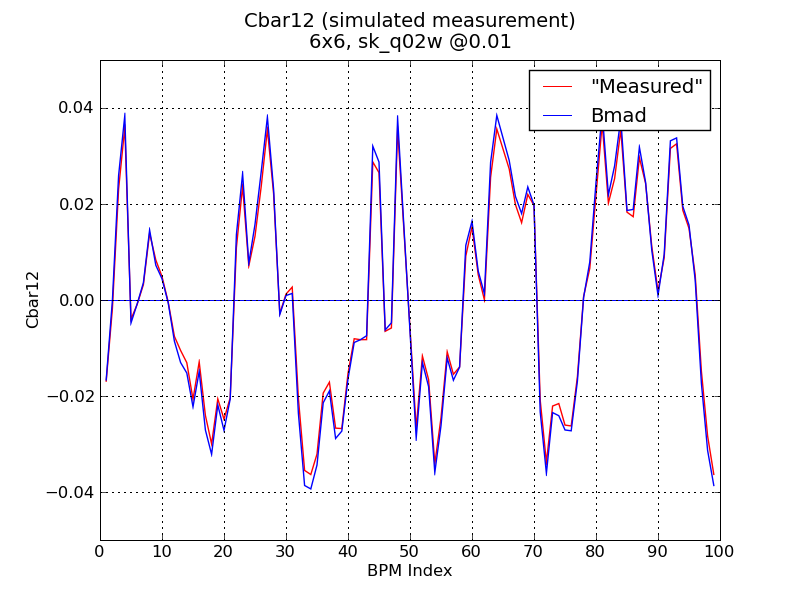
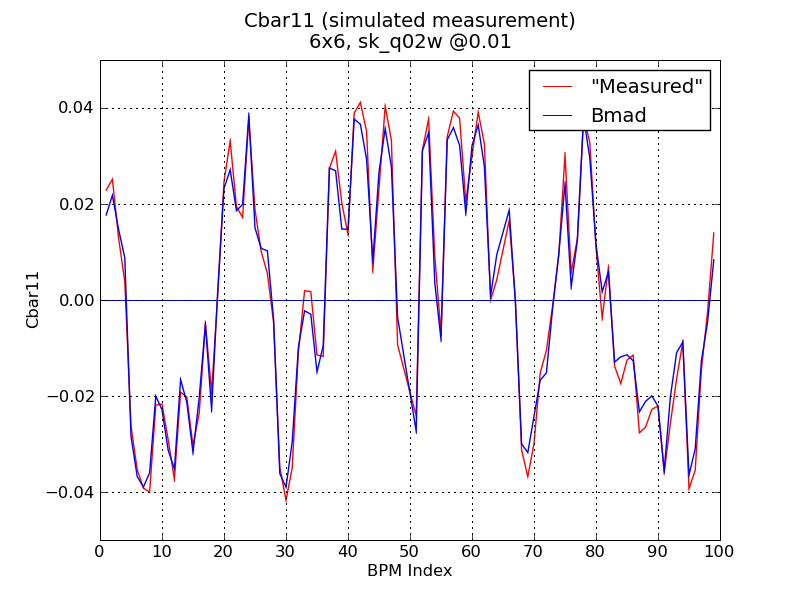
Finally, 6x6 tracking with sk_q02w @0.01:
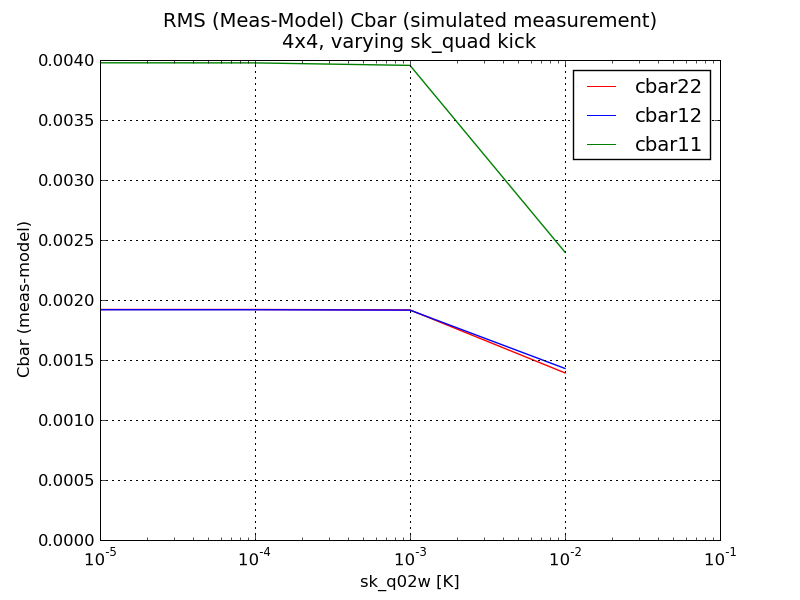
For all four scenarios, plot the RMS difference between 'measured' and Bmad model:
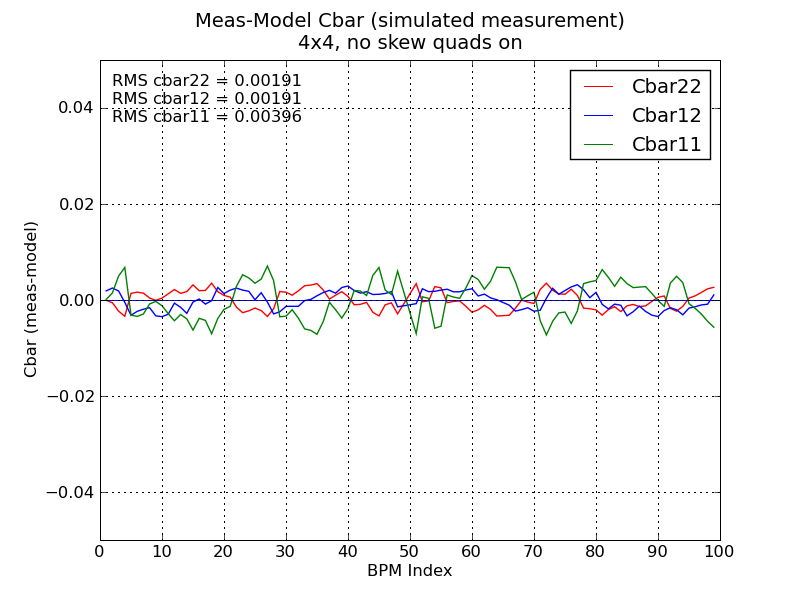
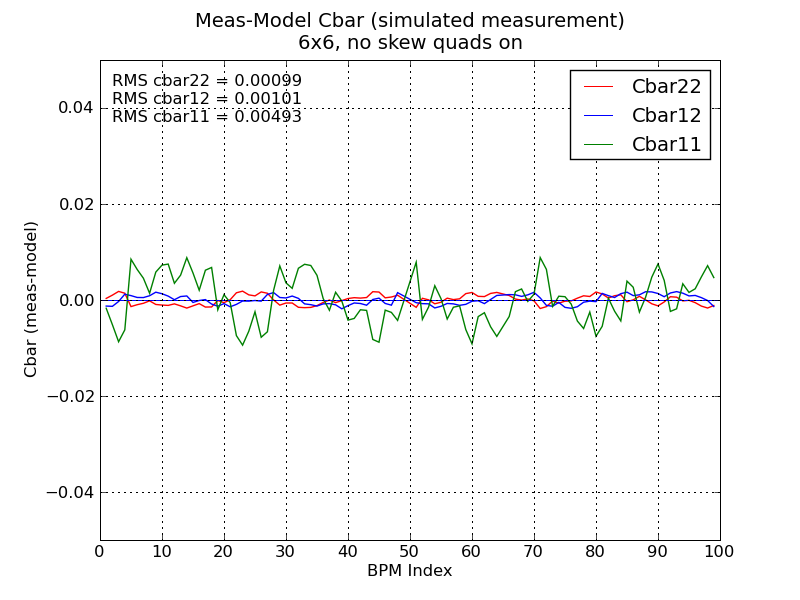
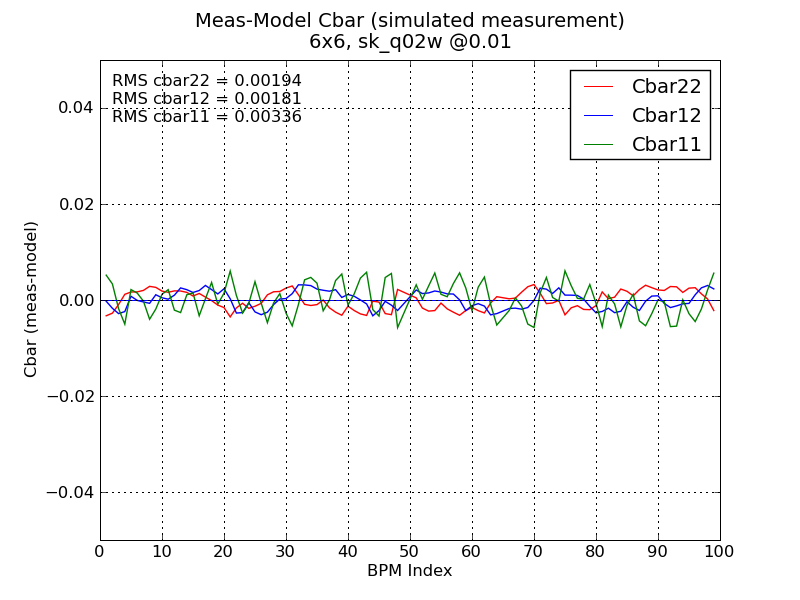
It appears that, in all scenarios, Cbar11 agreement is not as good as Cbar22 or Cbar12.
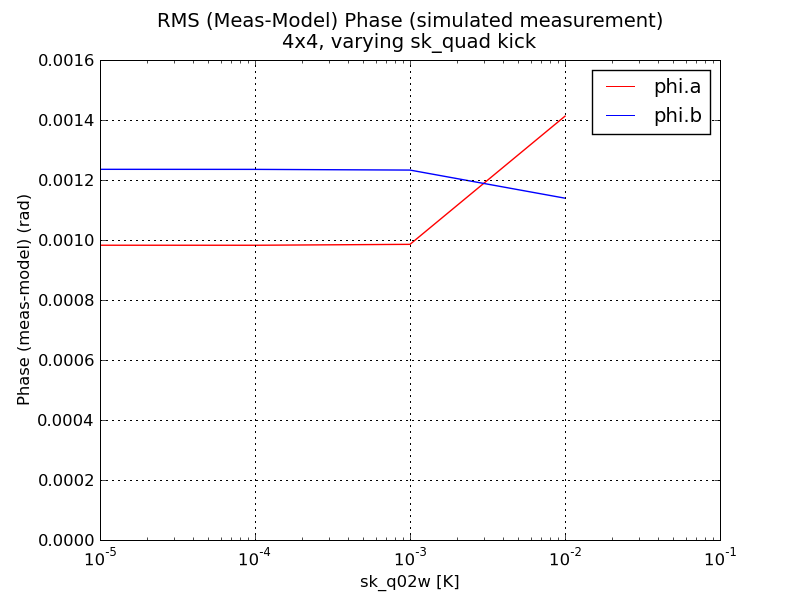
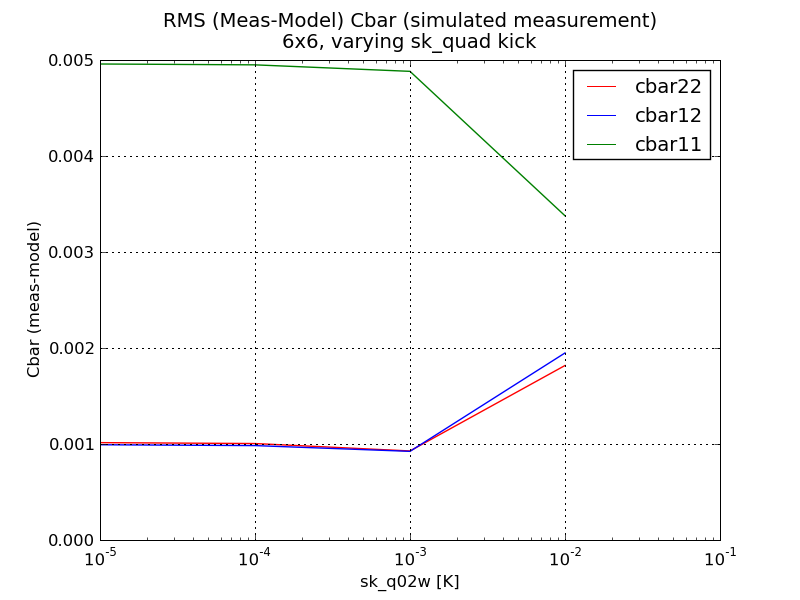
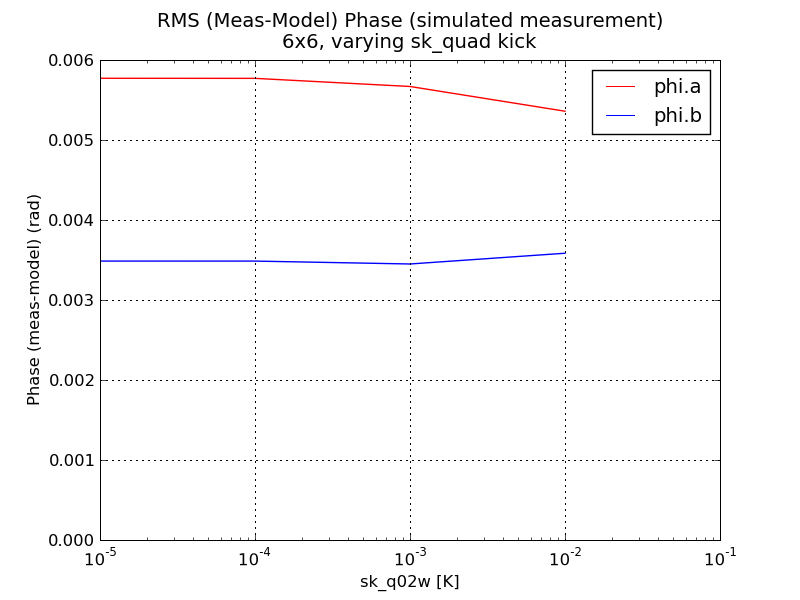
Now let's vary the strength of the skew quad kick being applied, and see if there's any dependence for Cbar / phase data.
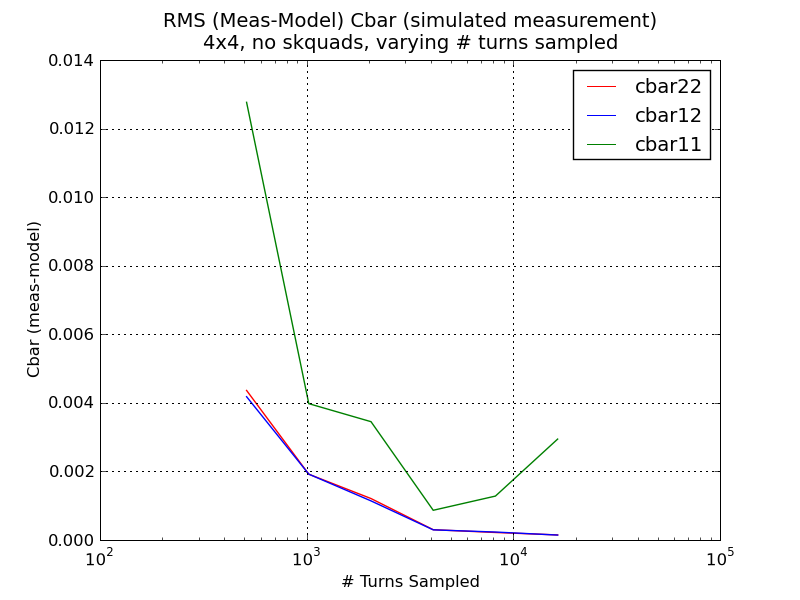
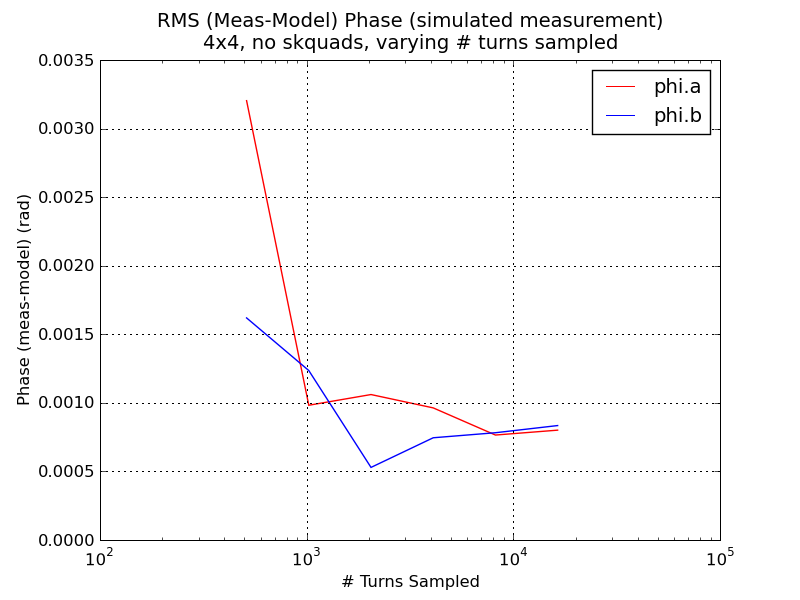
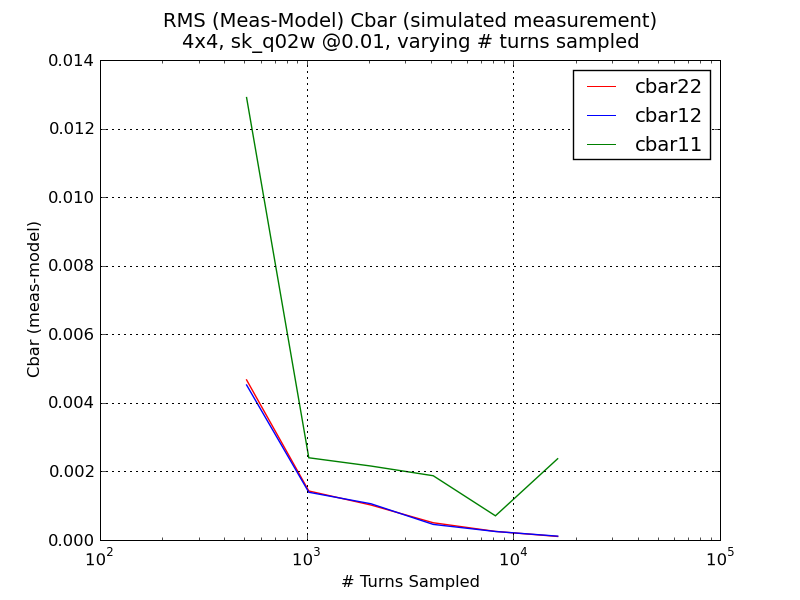
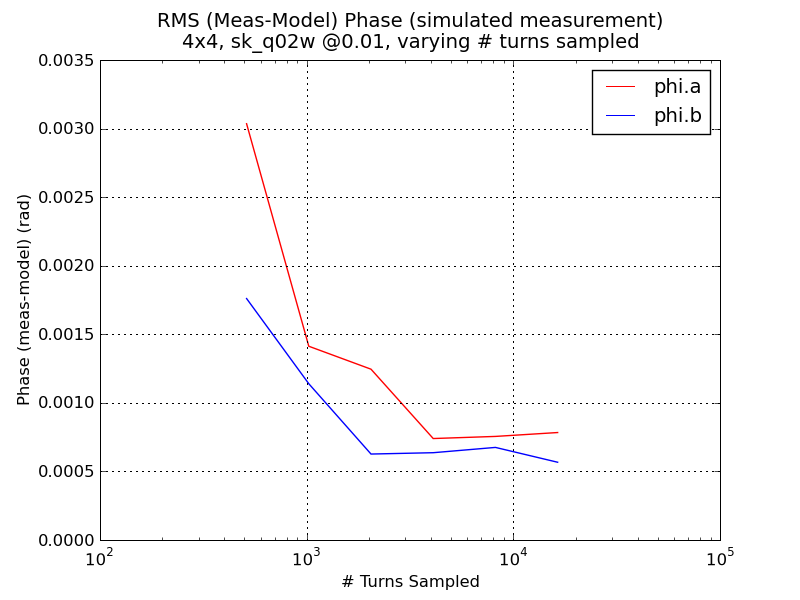
Now examine the dependence of the quality of data on the number of turns sampled. As before, use an ideal lattice with no errors or misalignments. Both with a skew quad on and off, and for both 4x4 and 6x6 tracking, vary the number of turns sampled and record the RMS Cbars and phis. Start with 4x4 tracking:
Repeat for 6x6 tracking. Recall: we damp for 40k turns before sampling n_turns for 6x6:
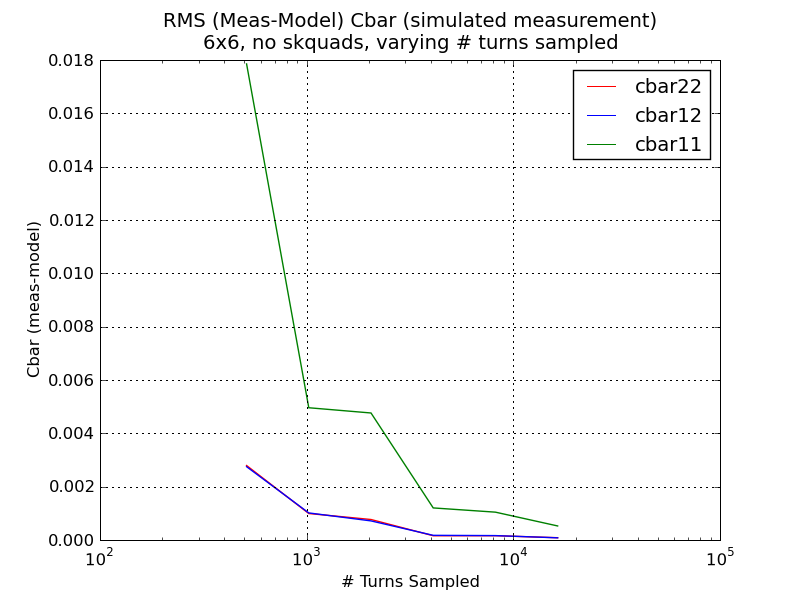
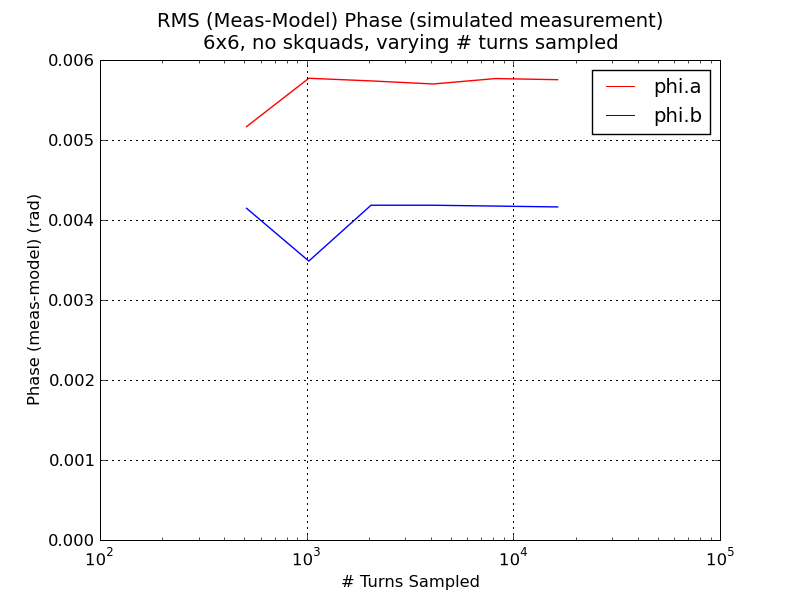
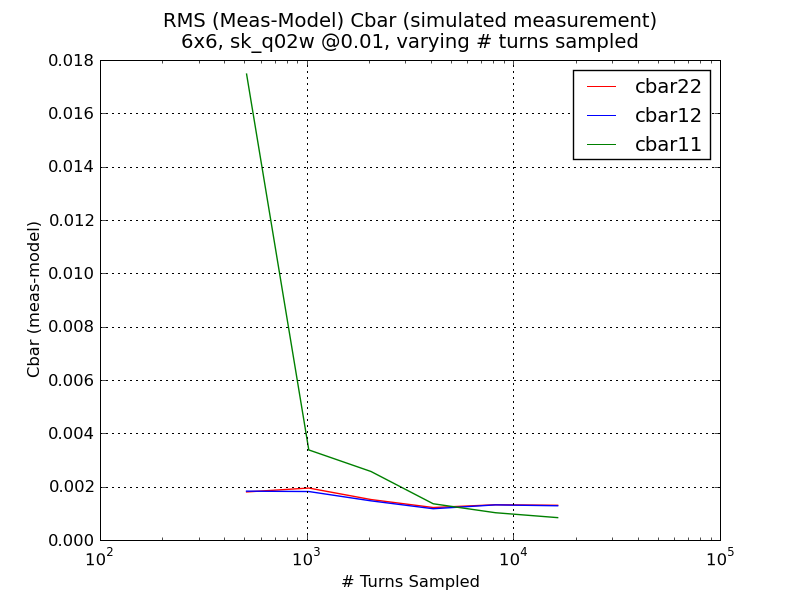
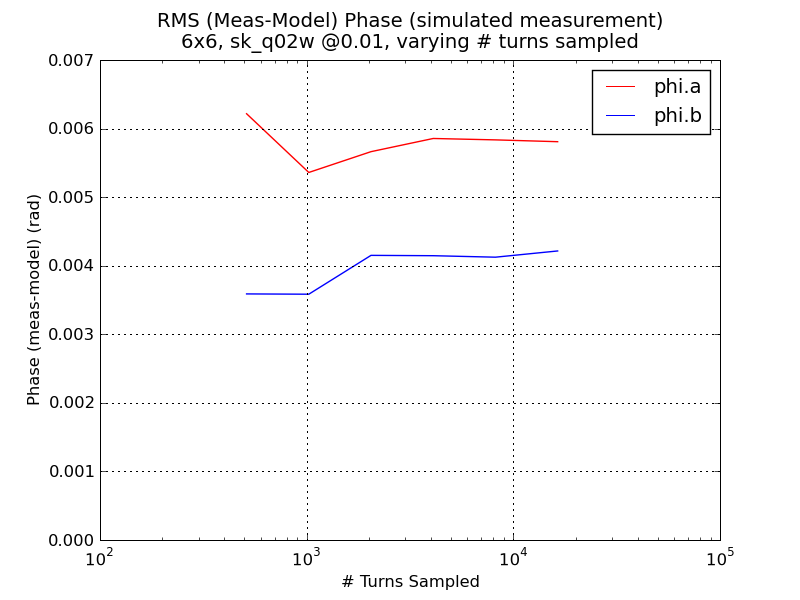
In the 4x4 scenarios, RMS (meas-bmad) phi decreases as the sample size increases. However, in 6x6 tracking we see the RMS phi remains roughly constant. Once again it appears that Cbar11 behaves very differently from Cbar12 and Cbar22. Recall that both Cbar22 and Cbar12 are (in this case) calculated strictly from a-mode data, whereas Cbar11 is calculated using b-mode data. Could this affect the quality of Cbar11 data?
It appears the quality of data is best at about 8192-16384 turns. From now on, default to using 16384 turns, as that is the actual sample size when taking measurements in CESR.
The 'normalized' amplitudes used to calculate Cbar elements are re-scaled by 1/sqrt(beta). After this normalization, the amplitudes of one mode across all BPMs should be exactly the same. Let's verify this is true. For each of the 'standard' jobs (4x4,6x6 tracking; w/ and w/o sk_q02w on), find the mean and RMS of each distribution. Recall these jobs are now sampling 16384 turns:
| Scenario | mean Aa | \sigma(Aa) | \sigma(Aa) / Aa | mean Bb | \sigma(Bb) | \sigma(Bb) / Bb |
|---|---|---|---|---|---|---|
| 4x4, skquad off | 5.3452E-5 | 4.0916E-8 | 0.076547% | 4.5578E-6 | 3.5399E-9 | 0.077667% |
| 4x4, sk_q02w @0.01 | 5.3227E-5 | 3.9772E-8 | 0.074721% | 4.5678E-6 | 2.2925E-9 | 0.050188% |
| 6x6, skquad off | 1.8948E-3 | 1.1254E-5 | 0.59394% | 7.5842E-4 | 2.9092E-6 | 0.38359% |
| 6x6, sk_q02w @0.01 | 1.8940E-3 | 1.1431E-5 | 0.60354% | 7.5528E-4 | 2.9379E-6 | 0.388988% |
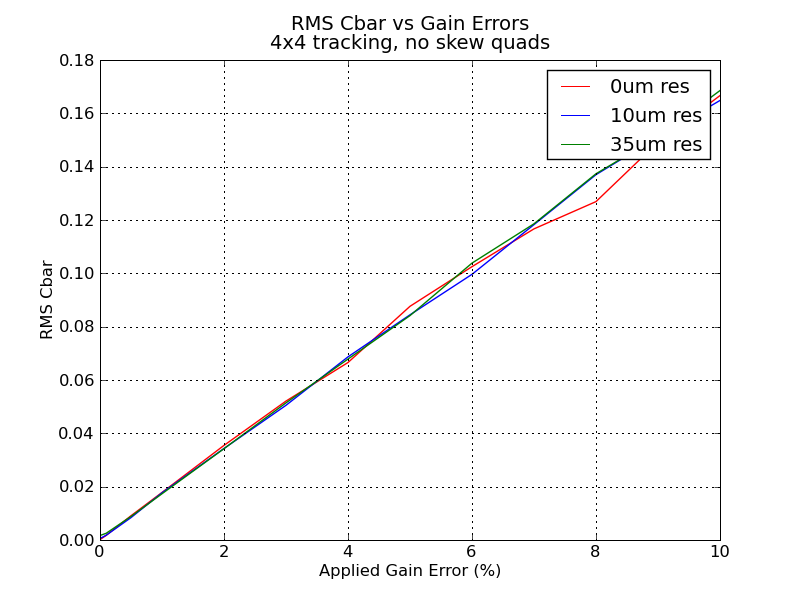
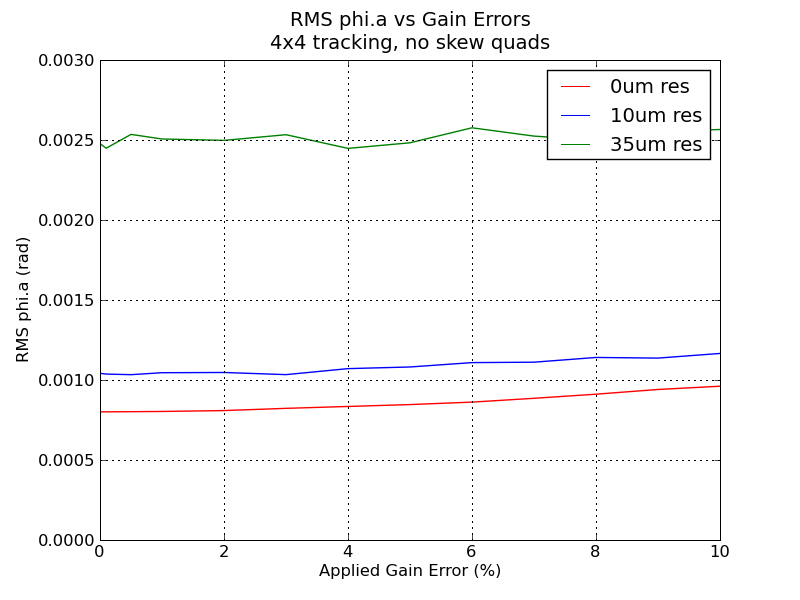
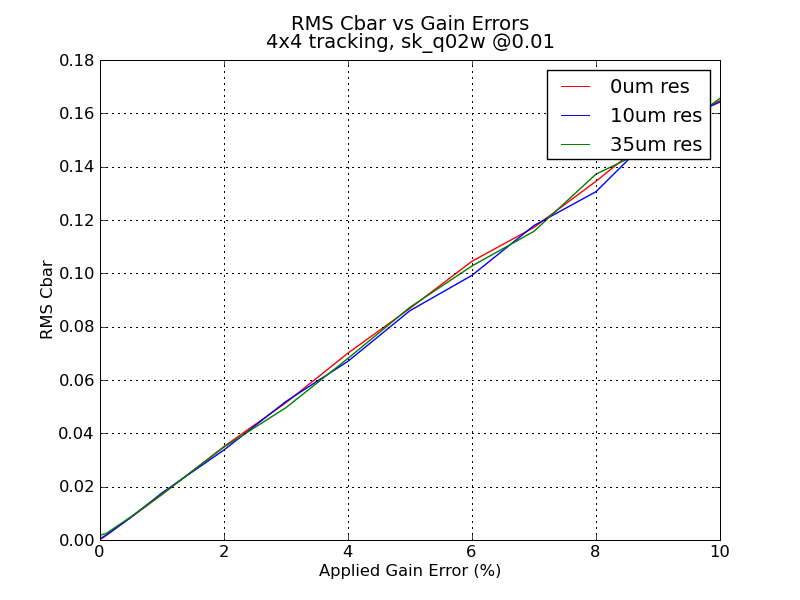
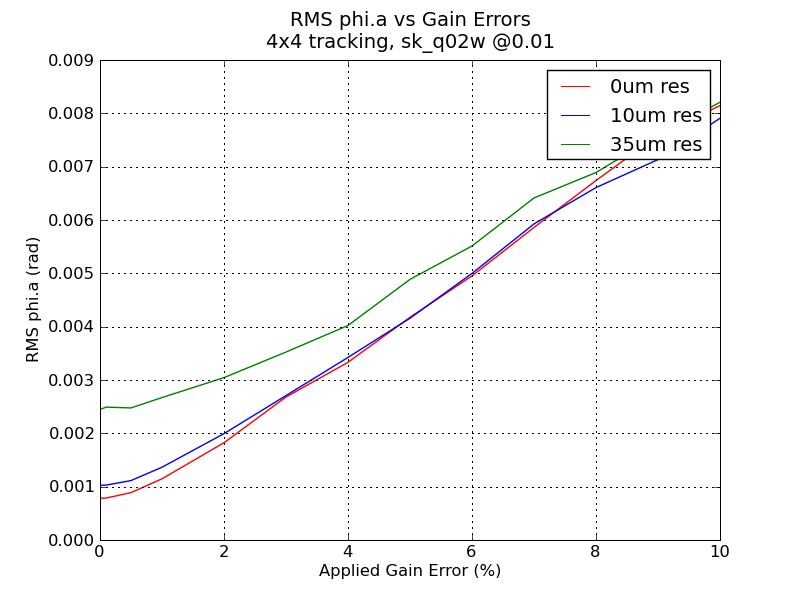
Let's see how Cbar and phase RMS depend on gain errors. Apply a random set of gain errors at all BPMs at the indicated sigma, and see what the resulting RMS (meas-Bmad) Cbar12 and phi.a are. For each data point, repeat for 50 random seeds and take the average RMS. Sample size is 16384 turns. First look at 4x4 tracking:
Next, 6x6 tracking. As always, damp 40k turns before sampling:
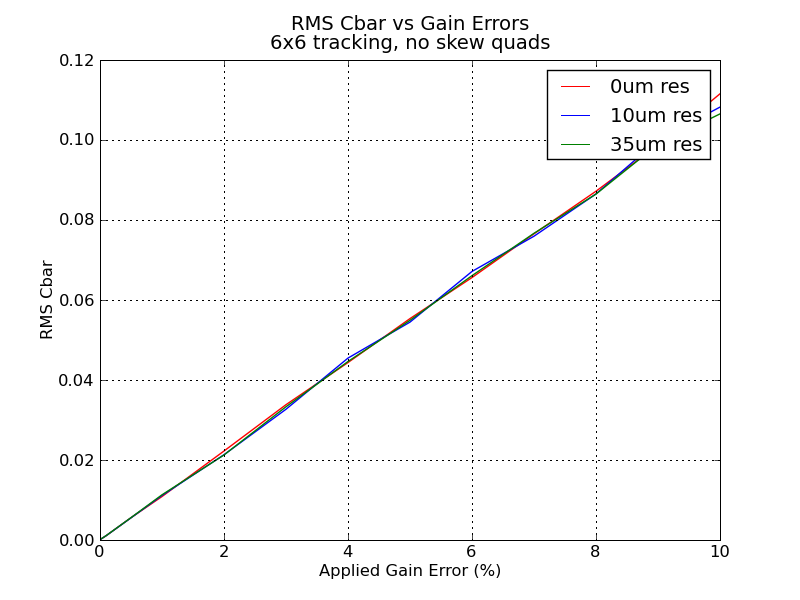
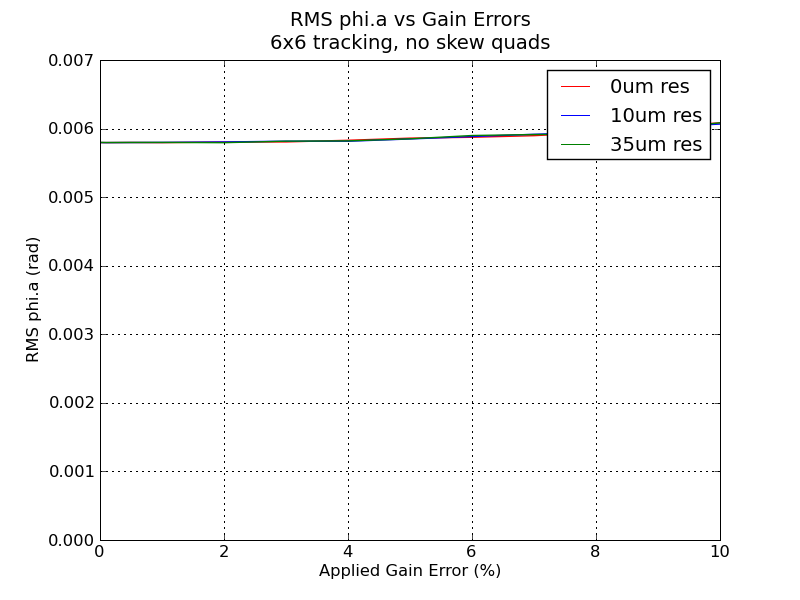
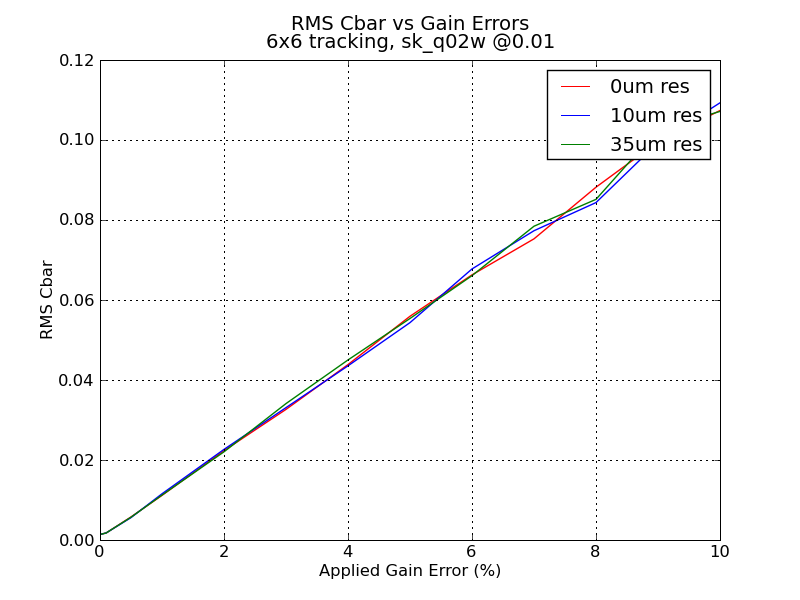
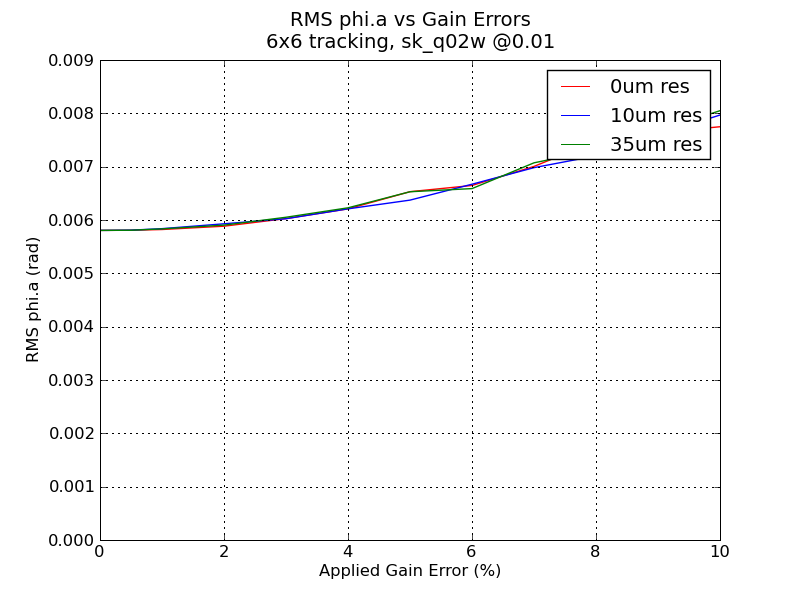
Looks like at the magnitude of gain errors investigated here, Cbar is quickly dominated by the gain errors rather than resolution. For phase measurements, 6x6 appears to be unaffected by choice of resolution and only marginally sensitive to gain errors. However, above 8% gain errors with skew quads on, 4x4 and 6x6 phi RMS roughly agree. Looks like the 6x6 phi measurement is fundamentally limited to about 6mrad RMS, whereas 4x4 phi measurement is more like < 1mrad.
Refine the study by only examining the region with gain errors < 1%: