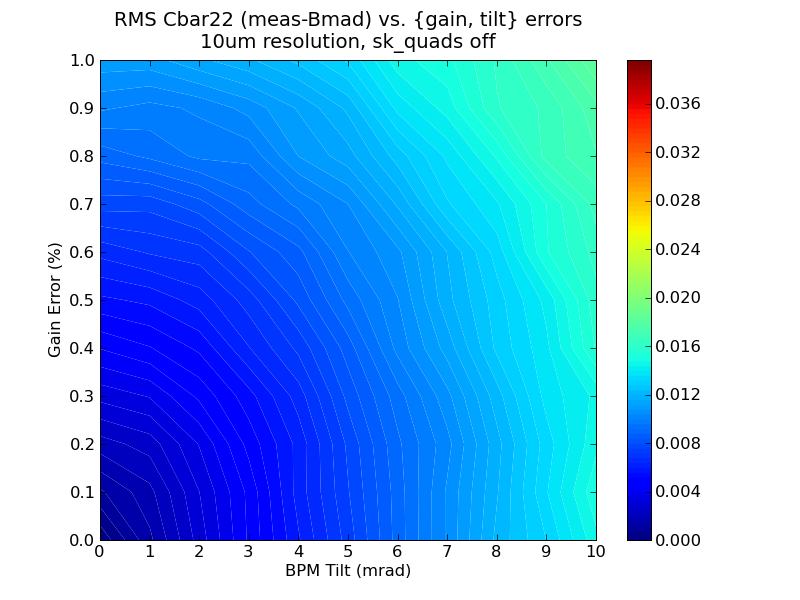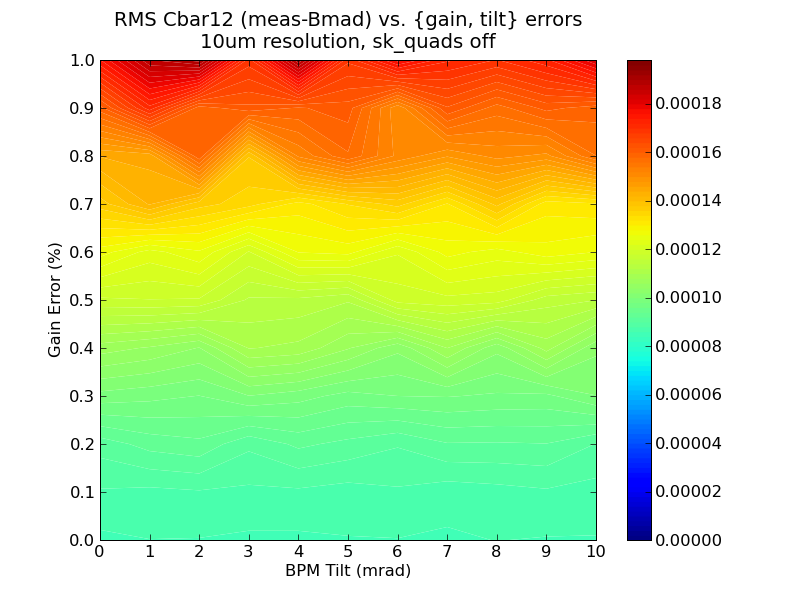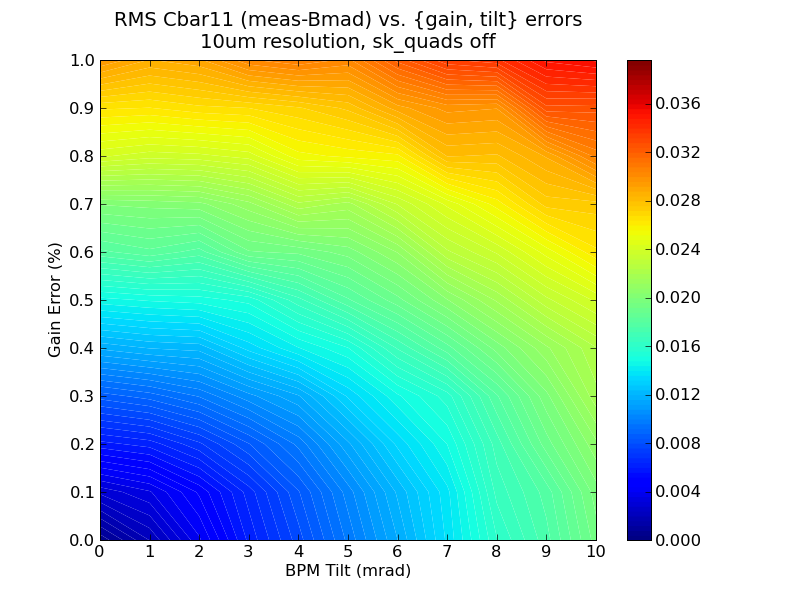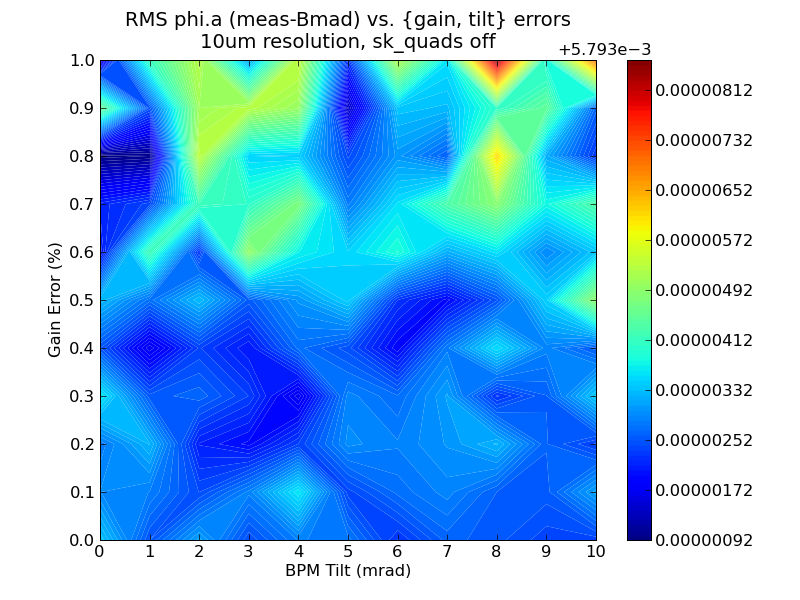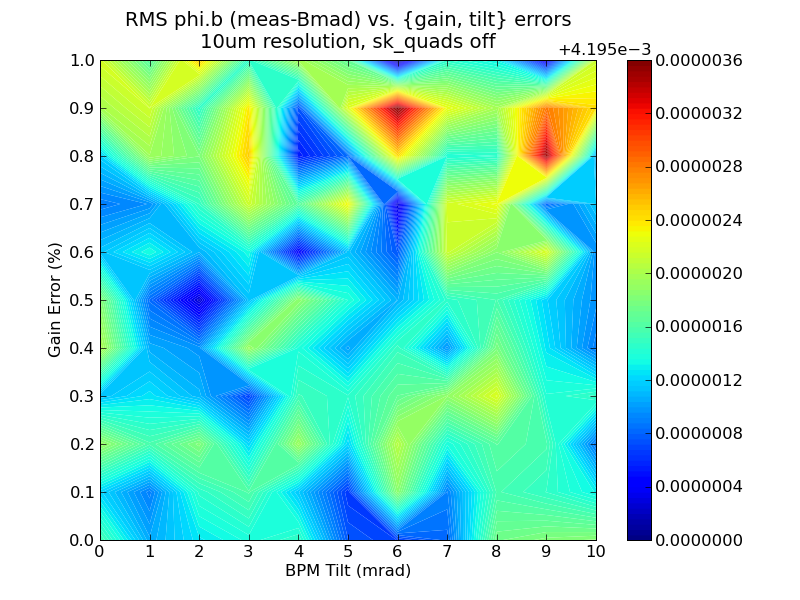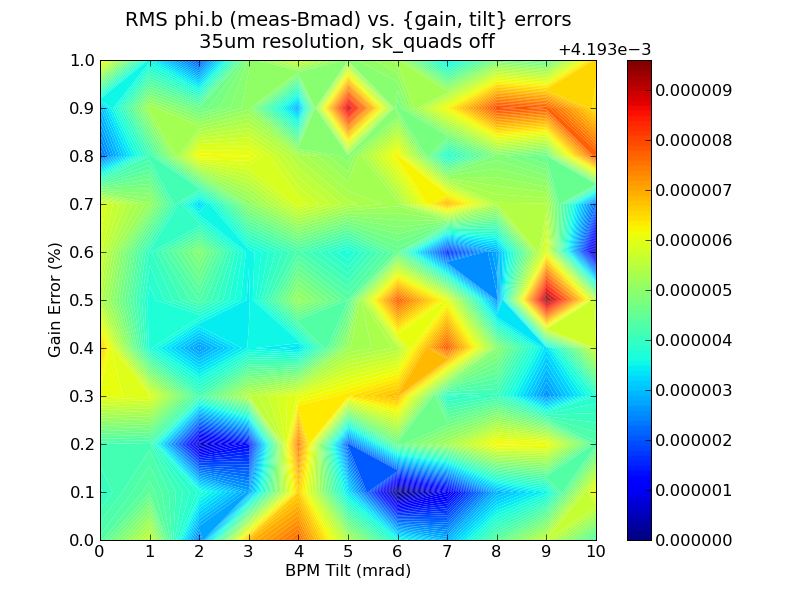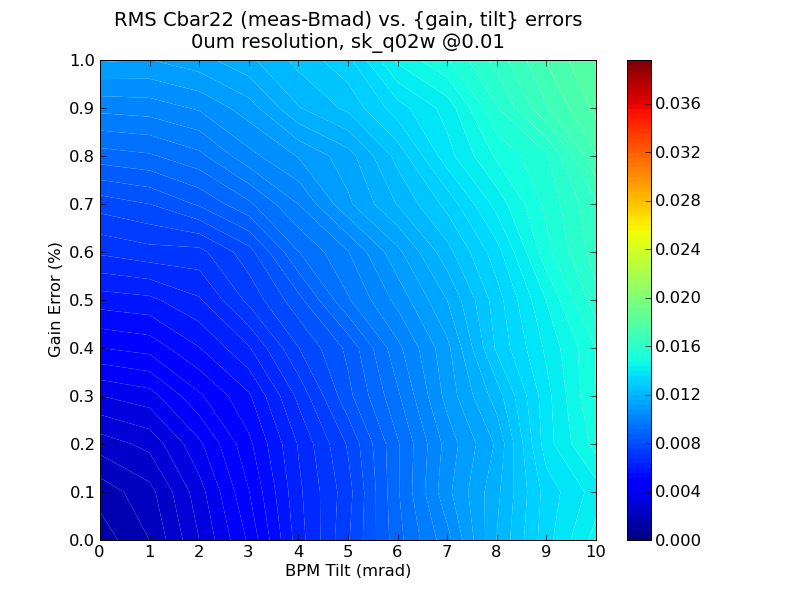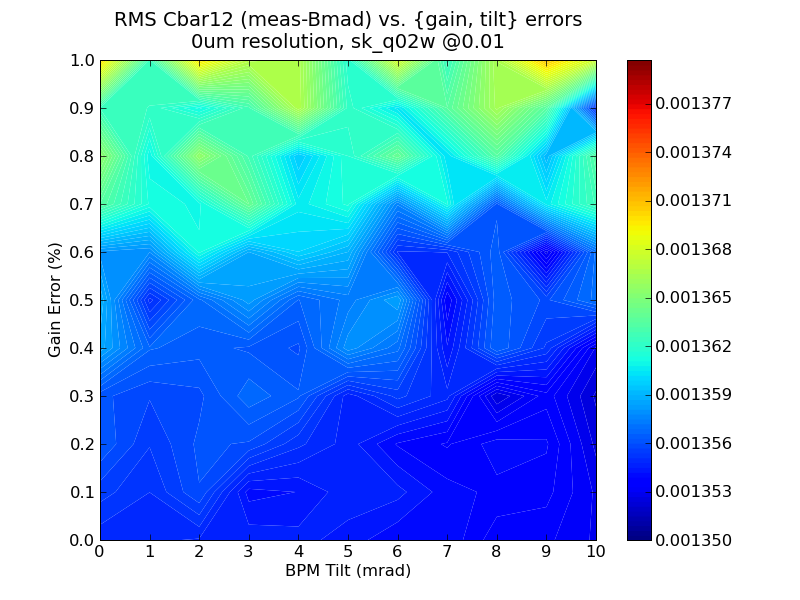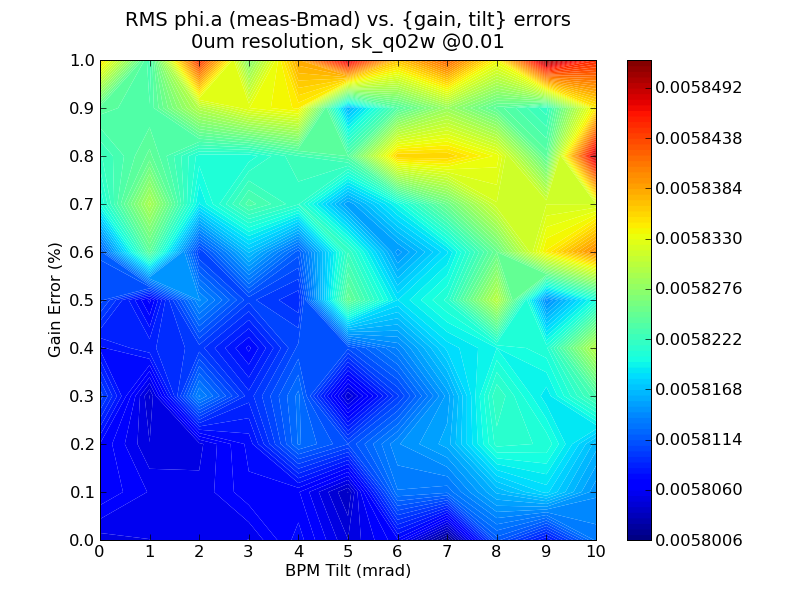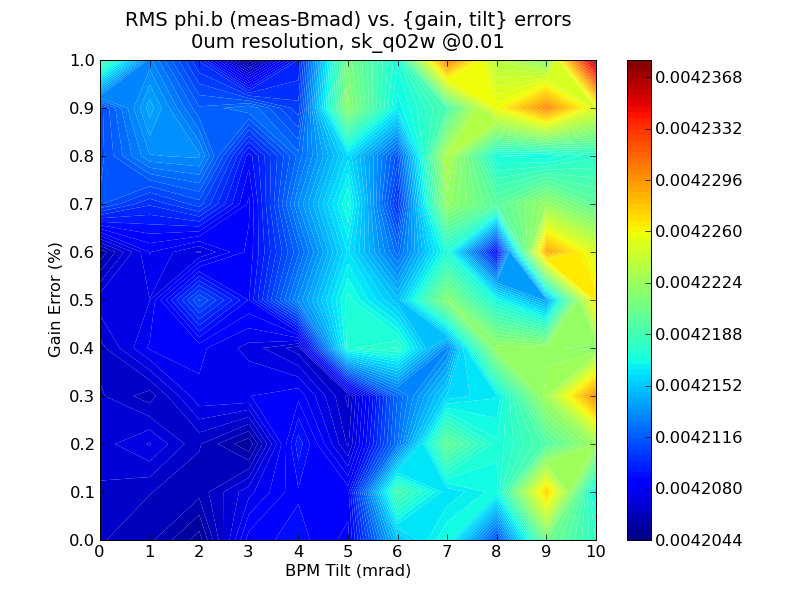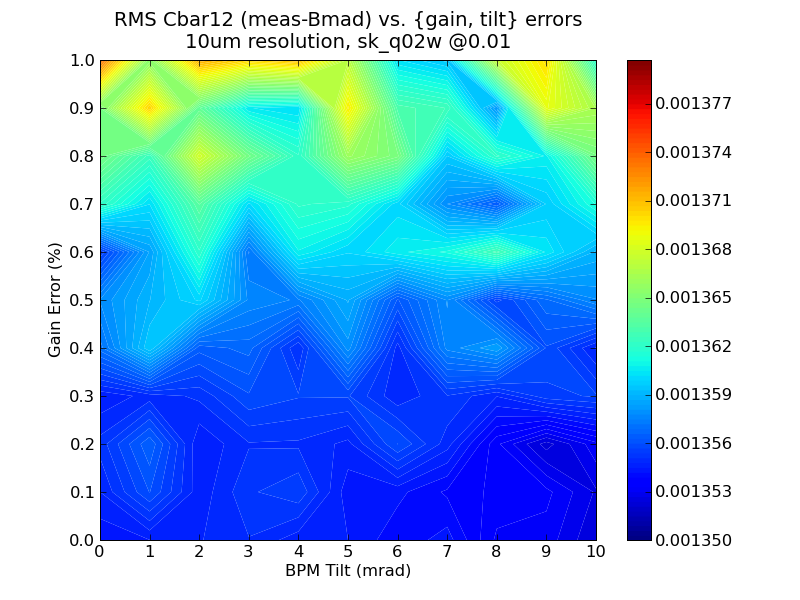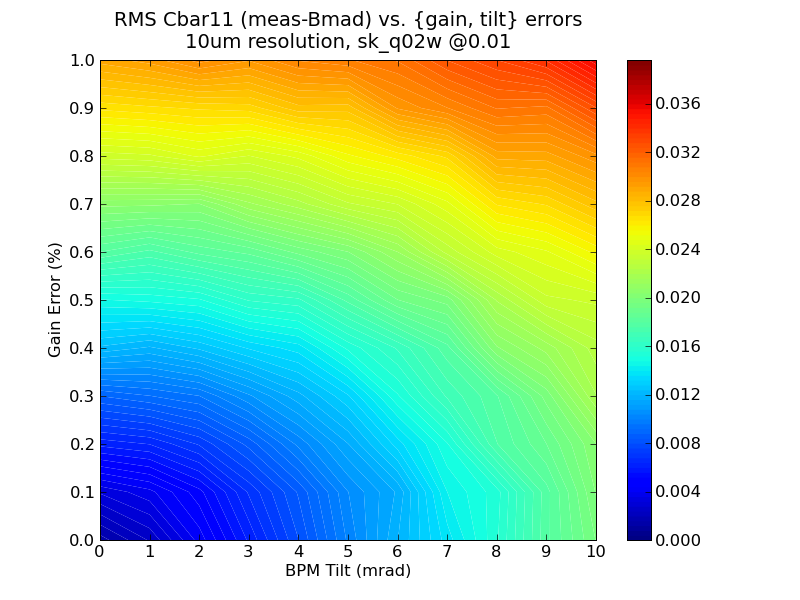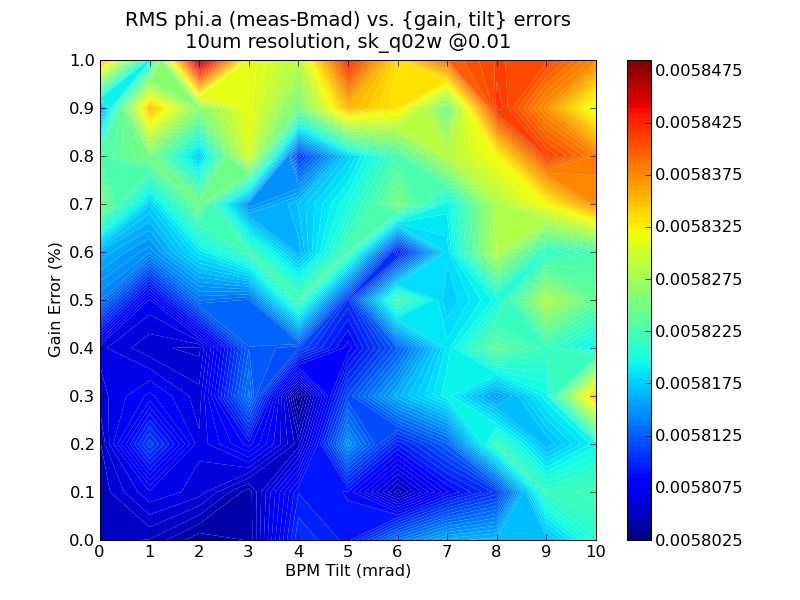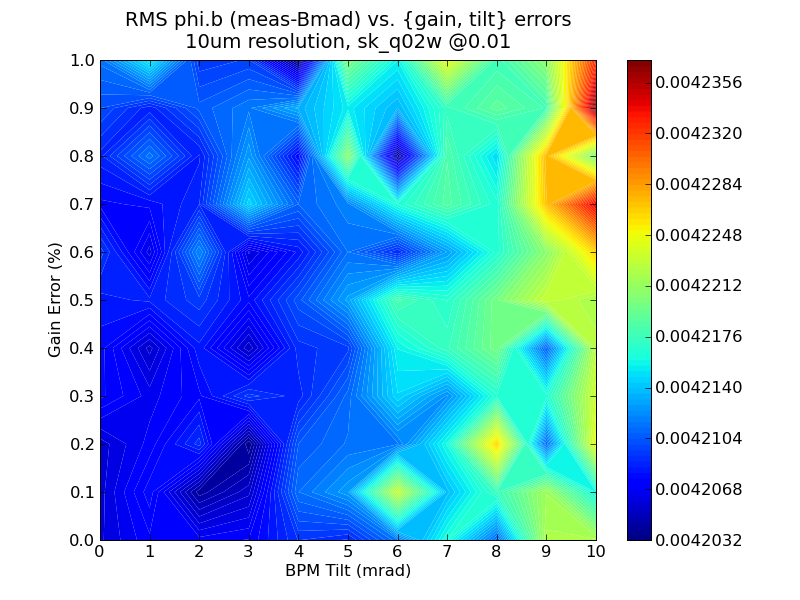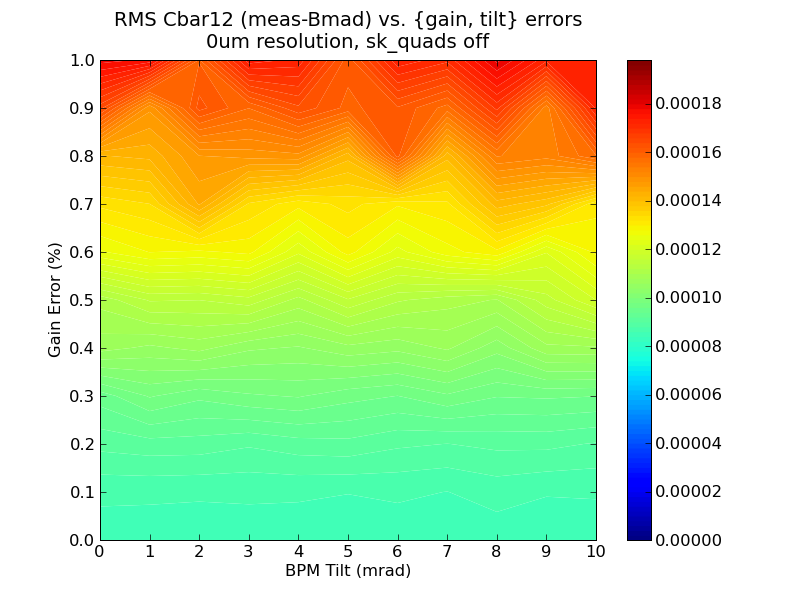
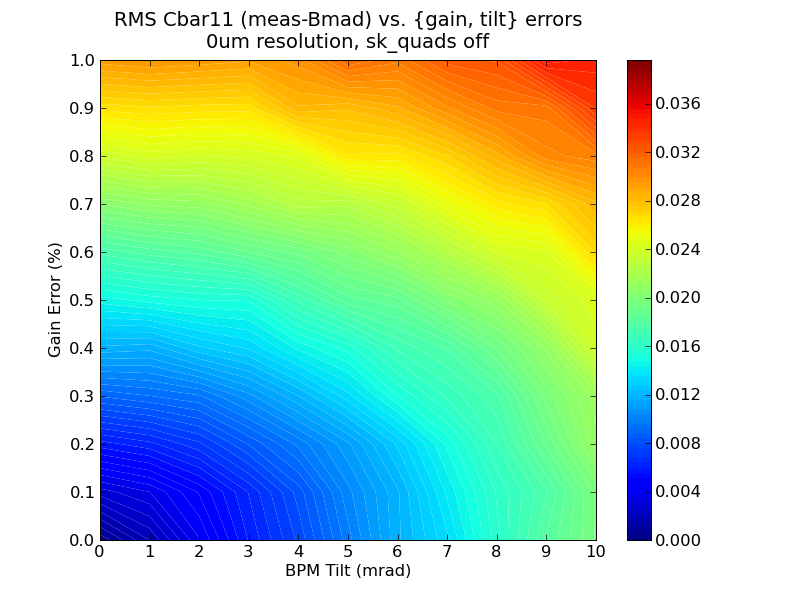
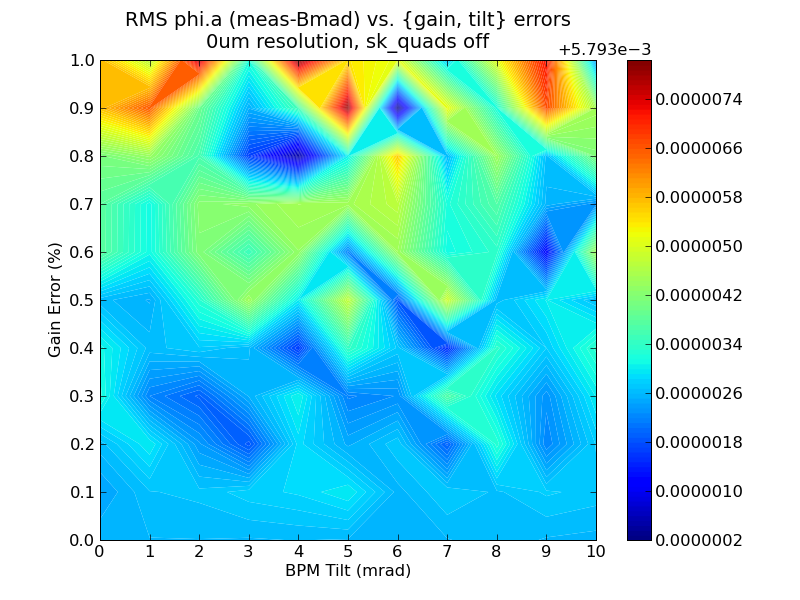
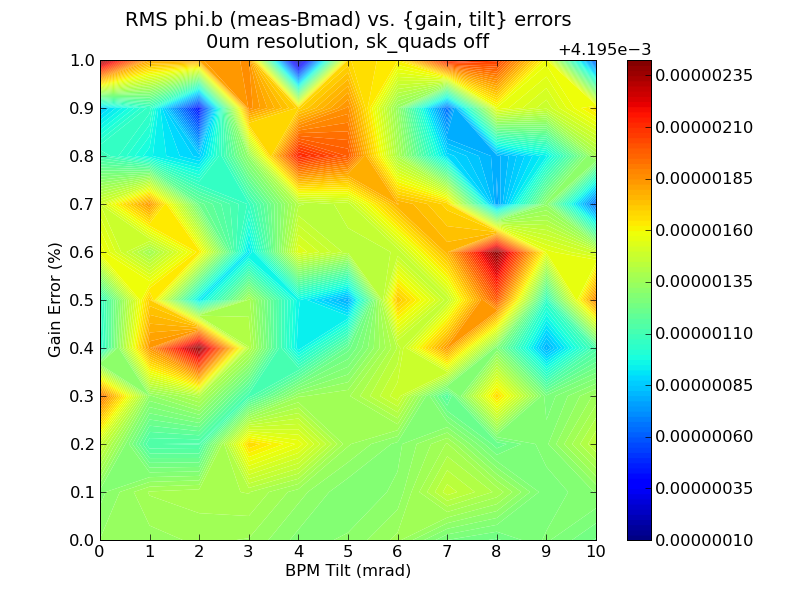
How are Cbar and phase measurements affected by a combination of BPM tilts and gain errors? Run the following simulation:
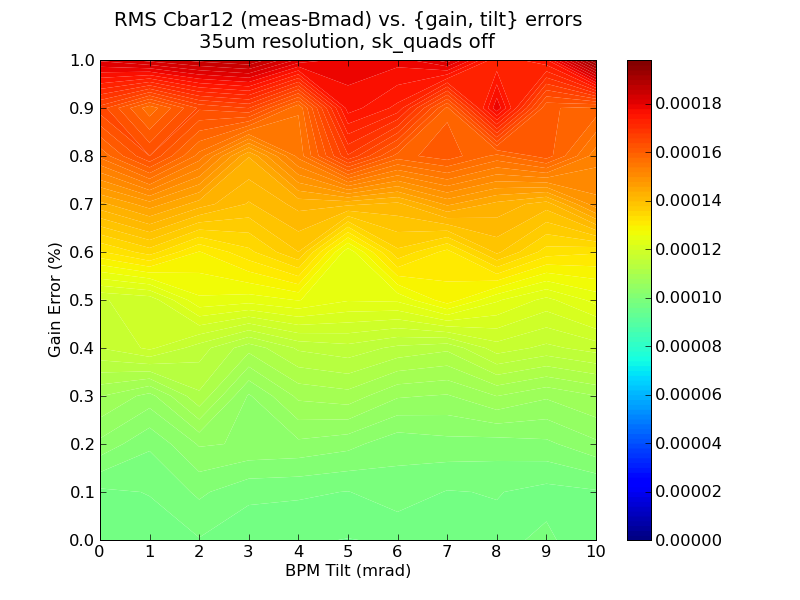
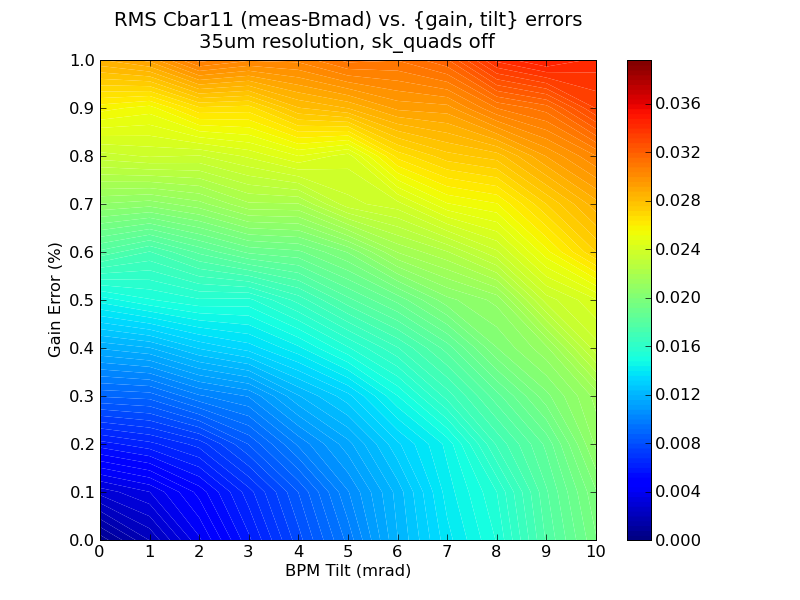
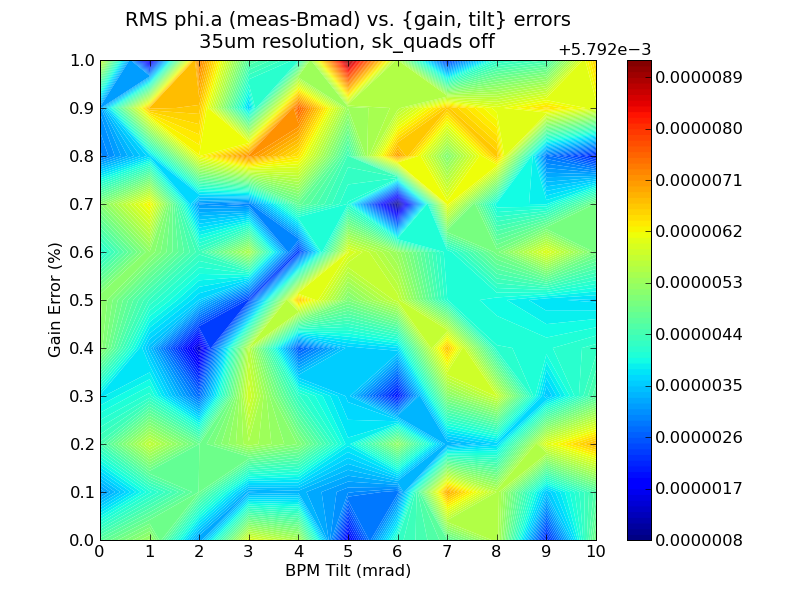
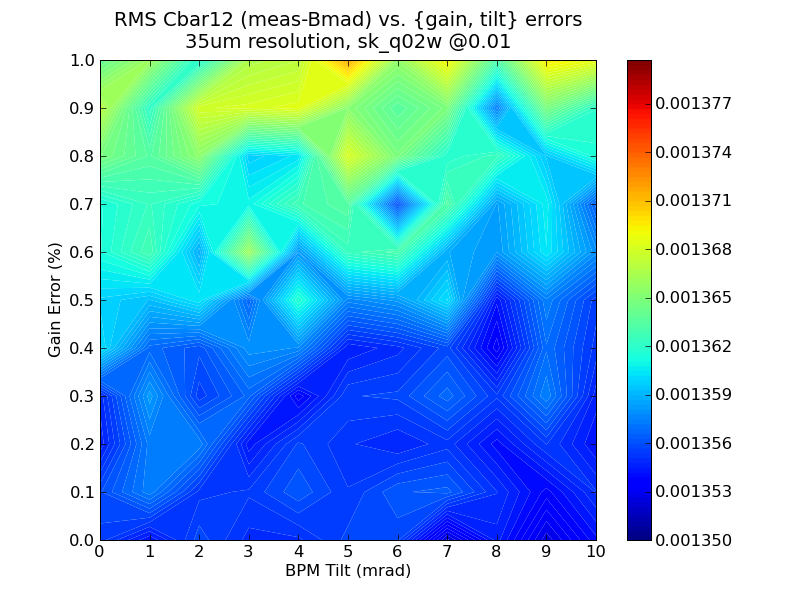
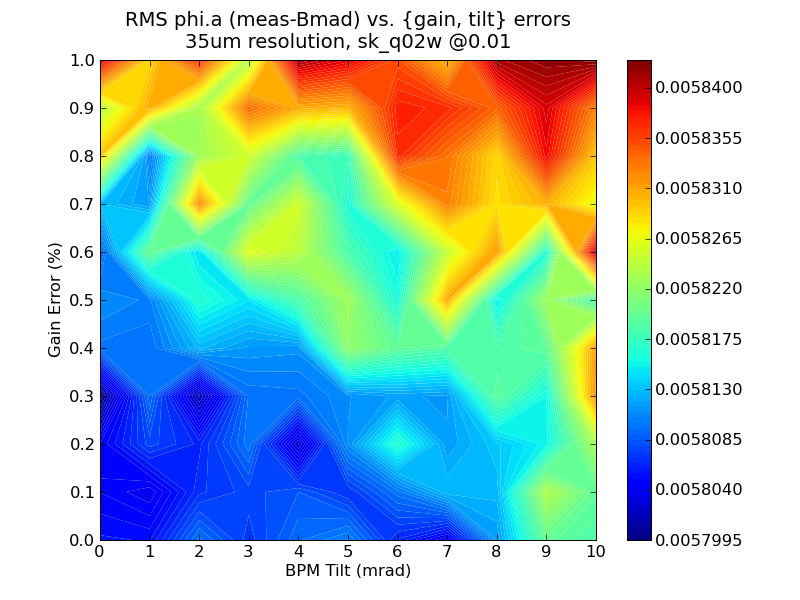
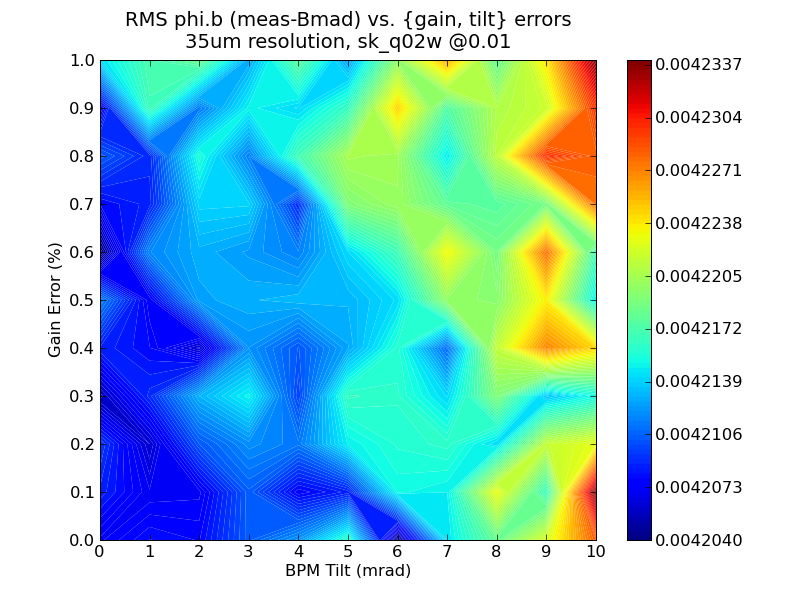
Make contour plots for each type of measurement as a function of RMS applied BPM tilts and gain errors. Repeat for resolutions of [0,10,35] microns.
NOTES: Across all resolutions, Cbar22 and Cbar11 share the same scale. Cbar12 changes scale by an order of magnitude when skew quads are introduced; otherwise plots are on the same scale throughout. Phase plots DO NOT have the same scale in all places! The number at the top of the color scale for phase plots indicates to add that number to whatever the color represents. (There is a very narrow distribution around a single value for phase measurements)