We now have estimated correction levels for gain mapping and BPM tilts at 0, 10, and 35um resolutions, assuming actual gain errors < 5% and actual BPM tilts are RMS = 10mrad. This is summarized in the following table:
| Resolution | Residual Gains (RMS) | Residual BPM Tilts (RMS) |
|---|---|---|
| 0um | 0.03% | 0.69mrad / 2.1mrad |
| 10um | 0.17% | 1.78mrad / 2.65mrad |
| 35um | 0.6% | 5.96mrad / 5.43mrad |
For tilt residuals, the first number is when we use Cbar22+12+11 data. The second number is when we only use Cbar22+12 data. In both scenarios, first fit Cbar12 with only vertical steerings, then fit all applicable Cbar data using only BPM tilts.
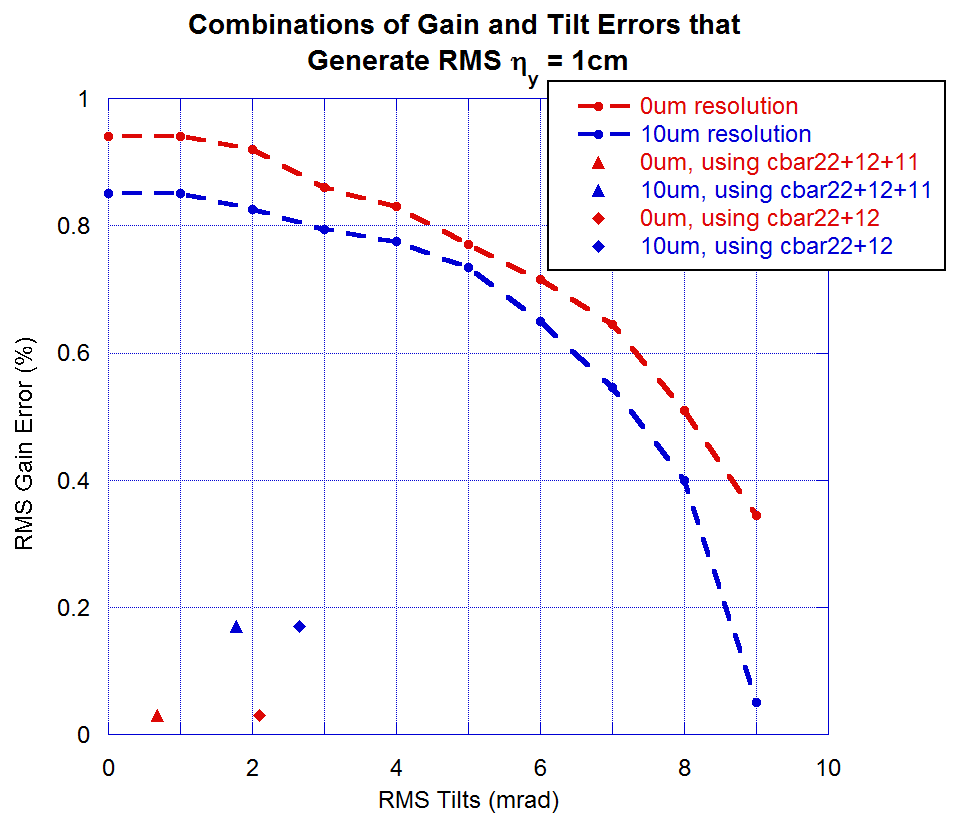
Recall the main reason for measuring BPM tilts accurately: to measure a 1cm RMS vertical dispersion. If we assume the actual eta_y is zero, what combinations of tilts and gain errors result in a 1cm RMS eta_y? (Same idea as on 2009.08.11, but this time look at different resolutions too). Additionally, plot the above combinations on this graph to see if they allow for 1cm eta_y measurements.
Note that at 35um we are not capable of a 1cm vertical dispersion measurement at any combination of BPM tilts and gain errors. Also note that this plot doesn't entirely agree with the plot from 2009.08.11; this plot encloses a slightly larger area. I would trust this plot, though... many typos and errors have been corrected since the first plot.
However, this dispersion simulation is not entirely realistic: in an actual measurement, we average the orbit over 1024 turns (verified by MCR). In this simulation we are only using a single orbit measurement at each energy! By averaging over 1024 turns, we expect a reduction of 1/sqrt(n_turns) in the measurement error. Re-run these jobs with averaging for 1000 turns for both orbits in the dispersion measurement. (This will take a very long time-- roughly 2 days?)