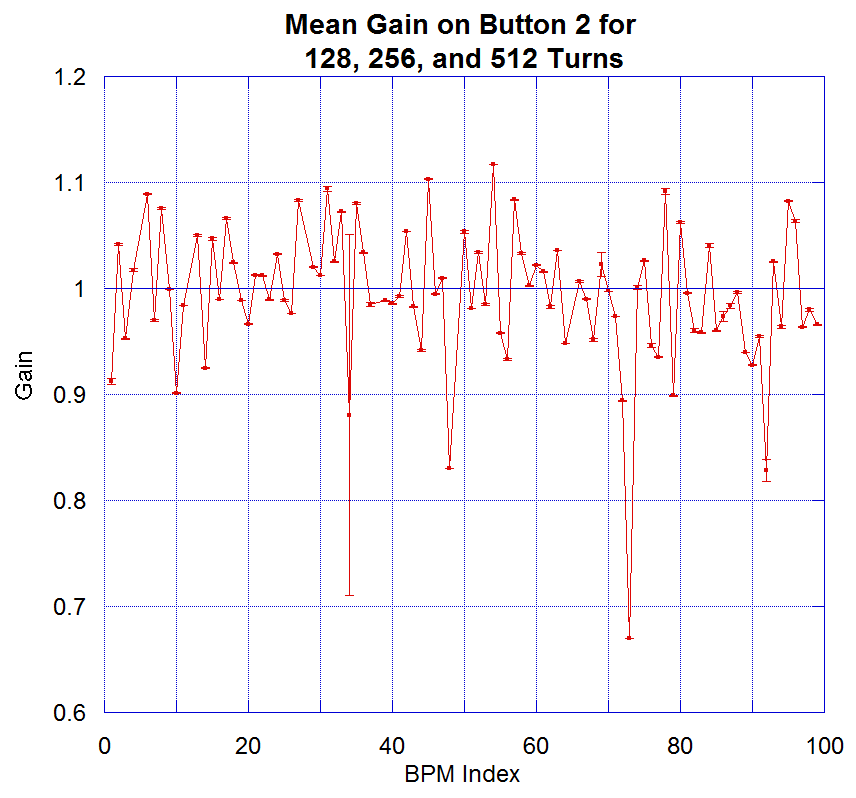
Using the same set of TBT data (RD-001893,4), compare KEK-style gain mapping fits when using the first 128, 256, and 512 turns of data.
After fitting the gains for each scenario, take the mean and standard deviation of each fit and plot the results. Below is representative, only showing the gain on button 2 for each BPM: