Introduction
If we look at the deltaE (deltaE = E_reco - E_beam) distribution of the mode 1 where D decays to K pi pi0 for Data and MC. We can see that the peak of signal MC is shifted to higher side compared with data. From the plot, Mean_signal = -0.0043, Mean_data = -0.0056.
Data
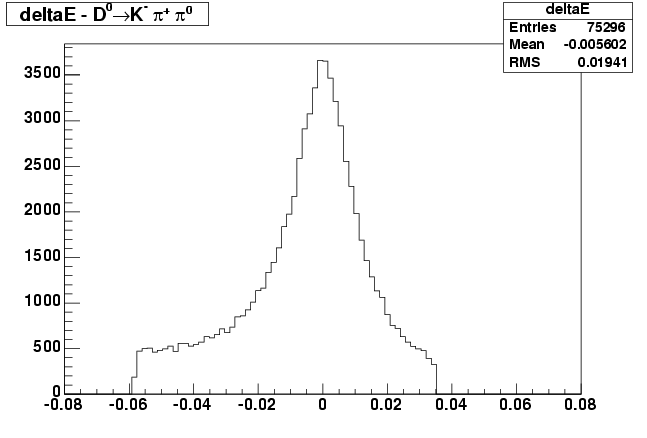
Signal MC

Process
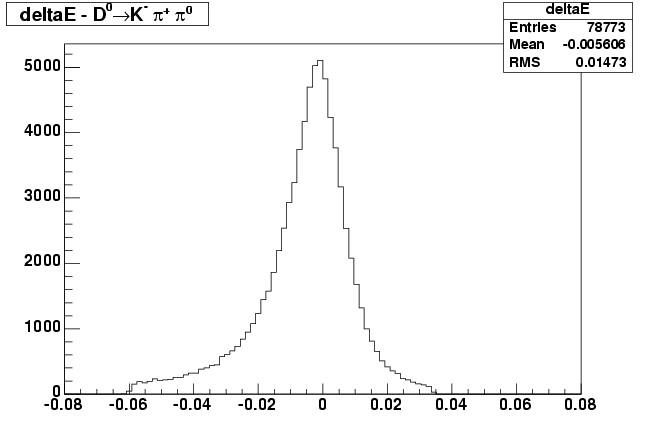
To compensate this shift, we can rescaple the pi0's momentum in
signal MC by a factor of 0.997. Then the deltaE plot for signal MC will be consistent with data as shown below. Where the mean value of deltaE changed from -0.0043 to -0.0056, consistent with data.
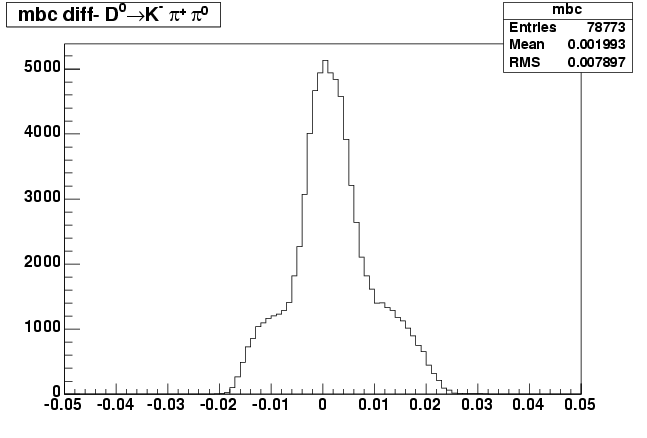
After rescaling the pi0's momentum, we can see the mbc also
changed - less than 0.03% level as shown in the plots below.
Conclusion
Then we fit the momentum rescaled events and compare the result2 with the regular one. The difference is negligible.
| Name | mbc/calc/pi0/0.997 | regular | diff(%) |
|---|---|---|---|
| N1 | 69769 ± 284 | 69799 ± 284 | -0.04 ± 0.58 |
| N2 | 70859 ± 286 | 70891 ± 286 | -0.04 ± 0.57 |
| Nbkgd1 | 9004 ± 142 | 8975 ± 141 | 0.33 ± 2.23 |
| Nbkgd2 | 8903 ± 141 | 8877 ± 140 | 0.30 ± 2.23 |
| md | 1.86470 ± 0.00001 | 1.86466 ± 0.00001 | 0.00186 ± 0.00043 |
| p | 0.89 ± 0.03 | 0.87 ± 0.03 | 2.05 ± 5.45 |
| sigmap1 | 0.00703 ± 0.00004 | 0.00694 ± 0.00004 | 1.39 ± 0.83 |
| xi | -44.75 ± 1.72 | -43.57 ± 1.71 | 2.72 ± 5.57 |
| chisq1 | 139 | 126 | 10.39 |
| chisq2 | 94 | 76 | 23.31 |