D-Hadronic Meetings 2011
Table of Contents
- 2011
- 2011-10-25
- 2011-10-11
- 2011-10-04
- 2011-09-27
- 2011-09-20
- 2011-09-06
- 2011-08-30
- 2011-08-23
- 2011-08-16
- 2011-08-09
- 2011-08-02
- 2011-07-19
- 2011-05-31
- 2011-05-24
- 2011-05-17
- 2011-05-10
- 2011-05-03
- 2011-04-26
- 2011-04-19
- 2011-04-12
- 2011-04-05
- 2011-03-29
- 2011-03-22
- 2011-03-15
- 2011-03-08
- 2011-03-01
- 2011-02-15
- 2011-02-08
- 2011-02-01
- 2011-01-25
- 2011-01-18
- 2011-01-11
- 2011-01-04
2011


2011-10-04
- Use the KEDR Mass to get the yield:
Previous procedure to evaluate the lineshape syst:


Use KEDR mass:

Shall we increase the range ?
- CVS repo for dhadprd818 paper:
~ryd/CVSROOT/dhadprd818
- Todo:
Create table with chisq to compare.
2011-09-27
- CP Asymmetries update
Previously, the updated ACP for 818/pb is:

It turned out previous ACP calulation didn't count the bkgd uncertainties: HyperNews Link. So, If I ignore the background uncertainties, I get:


Comments from Peter: because the background error and yields are correlated, treating the background uncertainties as uncorrelated is larger than the true value. So, in first order, treating them without uncertainties should be enough.
- Questions from Committee:
Current Version of CBX: (PDF)
- Discussion about the KEDR result?
From Werner:
KEDR have finally released their measurement of psi(3770) mass and width: http://arxiv.org/abs/1109.4205 . Presumably this affects your systematics….
Xin :
Thanks for pointing out. I have read that paper and noticed their psi(3770) mass has a 3-sigma difference than the BES-II value (which we use). On the other hand, the width is the same. Currently we are using +/- 0.5 MeV variation for the psi(3770) mass in the mBC fitting, while the results from KEDR have a relatively large uncertainties (~1.9 MeV). I'm wondering if that should affect our systematics evaluation procedure. …
Any suggestion or further comments?
Peter:
It's worth paying attention to the point the KEDR people make: their mass and width values need to be interpreted with the interference model they use. What's relevant to us is the (Born) cross-section, and whether the model that we are using describes this reasonably.
- Todo:
- Add explanation in the text for the colors and "see in the text" in the figures captions.
- Use the M = 3779.1 MeV in our fit and test the result for a few modes, in order to defend.
2011-09-20
- CP Asymmetries update
Re-calculated the previous ACP:

Updated the K,pi tracking for 818/pb: (PID not updated from Purdue group)

Check the large Kspipipi stat error.
2011-09-06
- CP Asymmetries study


But using this two numbers only gives ~1.5%. How to get 0.85%?
- Todo: Send out the committee questions.
2011-08-30
- KKpi components efficiencies for old MC:
Old DECAY file for signal MC:
   Decay myD+
   0.003437   myphip pi+                       SVS;
   0.002796   myanti-K*0p  K+                         SVS;
   # Is 0.0087 too high?
   0.0087   K+   K-  pi+                    PHSP;
   Enddecay
   #
| Mode | Eff(%) | phipi(%) | k0star(%) | phsp(%) |
|---|---|---|---|---|
| D+ → K+ K- π+ | 47.03 +/- 0.36 | 44.11 +/- 0.75 | 45.24 +/- 0.84 | 48.68 +/- 0.48 |
| D- → K- K+ π- | 46.73 +/- 0.35 | 42.42 +/- 0.74 | 46.07 +/- 0.83 | 50.06 +/- 0.48 |
New MC:
   Decay myD+
   0.00366685  myanti-K_0*0p K+                 PHSP;
   0.0031915  myphip pi+                        SVS;
   0.00299565  myanti-K*0p  K+                  SVS;
   0.0001     K+   K-  pi+                      PHSP;
   0.000044   myf_0p pi+                        PHSP;
   0.0000184  myf_2p pi+                        STS;
   Enddecay

- The large difference comes from the PHSP contribution in the old MC.
2011-08-23
- Finalize the syst uncertainty for KKpi:


- Updated the BFs using the new syst and update related tables for data in the CBX.
BFs compare with 281/pb results: table
- Todo: address committees questions in the CBX.
2011-08-16
- Using Peter's method:
Unfortunately, looking at the data/MC momentum comparison plots
from Tuesday, I don't think it's possible to reproduce data with
an incoherent mixture of the modes you have - there's pretty
clearly some interference.  That being said, I'd say that every
mode is within 30% of where it should be (at least there are few
data/MC differences larger than this; the big one is in the
middle of the pi+ spectrum where it shouldn't make much
difference).  So if you repeat the weighting procedure that David
wrote up with ~30% branching fraction uncertainties, I'd
personally be happy with using that number.
Mode BFs (PDG2007) Effs (%) D+ → φ π (3.2 ± 0.4) x 10-3 43.68 ± 0.38 D+ -> K*0 K+ (3.02 ± 0.35) x 10-3 45.21 ± 0.37 D+ -> K*1410 (3.7 ± 0.4) x 10-3 40.52 ± 0.33 Eff = 0.4297 +/- 0.0041 (0.94 %)
So, we'll use 0.94% as the systematic uncertainty for the result.

2011-08-02
- Average KKpi Efficiency
- Previous method (comparing data/MC):

- Peter's methord:

- Using David's methord PDF:
Mode BFs (PDG2007) Effs (%) D+ → φ π (3.2 ± 0.4) x 10^-3 43.68 ± 0.38 D+ -> K*0 K+ (3.02 ± 0.35) x 10^-3 45.21 ± 0.37 D+ -> PHSP (3.7 ± 0.4) x 10^-3 40.52 ± 0.33 The Average Eff = 0.4297 +/- 0.0024 (0.57 %)
So, shall we use the 0.57% uncertainty for the systematics for this mode ?
- Previous method (comparing data/MC):
- Todo: Make the momentum distribution plot for three components.
2011-07-19
- Undertand the difference in KKpi (used in my thesis)

2011-05-31
- Undertand the difference in KKpi
Done: Got the subset of the KKpi samples. (K0*, phi pi, PHSP)
Todo: Calculate signal efficiencies for each subset and evaluate the syst errors.
Will focus on thesis for the next 2-3 of weeks, defense time July 13th. Submission deadline July 29.
2011-05-24
- Undertand the difference in KKpi
Method from Peter's thesis: PDF
Kpi mass for data and signal MC:
- BFs for Generic MC
Use the old input for 10xlumi and new BFFitter can reproduce the same results.
281ipbv0.2 table (info) New fitter on 20xlumi generic smaple:
281ipbv12.1 table (info) - Question about "Data efficiency" for exernal backgrounds:
From CBX281:

- Todo:
- Check fitting plot
- Regen signal mc
- Absolute bkg subtraction
- Efficiency with pi, kion for syst.
- Create ratio difference column.
2011-05-17
- Undertand the difference in KKpi
Method from Peter's thesis: PDF
KK mass for data and signal MC without background subtraction: PDF
Fit the data with mBC using the DLineshape and argus bkgd: PDF
Takes very long to fit: figure, need simple bkg version to fit?
Q: How to count the events for different components?
- BFs for Generic MC
Last week, can produce the original result using the old 10x lumi Generic MC:
Label BFs 281ipbv0.0 table (info) 281ipbv0.1 table (info) This week, using the new 20xlumi generic MC:
Label BFs 281ipbv12.0 table (info) 818ipbv12.0 table (info) Still minor problems.
Can use the new fitter, difference?
- Todo:
- Make the Kpi invmass comparison plots.
- Take out different components to see the efficiency change.
- Fit old 10xlumi sample with new BFitter.
2011-05-10
- Undertand the difference in KKpi
Method from Peter's thesis: PDF
KK mass for data and signal MC in 281/pb: figure
Question: How to subtract the background in data?


A: The yields from the fitting are already background-subtracted! (Jim)
- BFs for Generic MC
281ipbv0.0: Exactly reproduce.
281ipbv0.1: Use the effs from my fitting procedure.
| Label | BFs |
|---|---|
| 281ipbv0.0 | table (info) |
| 281ipbv0.1 | table (info) |
2011-05-03
- Systematic study for KKpi with new MC with 818/pb: Momentum, systematics.
- DECAY difference :
Chain BF Old (%) BF New (%) D+ to phi pi+ 0.34 0.32 D+ to anti-K*0 K+ 0.28 0.30 D+ to K+ K- pi+ 0.87 0.01 D+ to anti-K0*0 K+ 0 0.37
- BFs for Generic MC
- Understand the asymmetry of yields
Check the yields in Generic MC:
Mode D Dbar Diff (%) Kpipi0 973050 980784 0.79 Kpipi 836152 846878 1.28 Check yields in data 281/pb:
Mode D Dbar Diff (%) Kpipi0 50276 50537 0.52 Kpipi 40248 40734 1.21 Very close to the generic MC. So, the asymmetry should not be the reason.
- Reproduce the 10xlumi Generic MC results:
Previous result: PDF
https://hypernews.lepp.cornell.edu/HyperNews/get/DHadGroup/73.html
My current: table
- Understand the asymmetry of yields
- Todo:
- Use Peter's Ds method to deal with KKpi change.
- Compare the double tag inputs for the generic Fit.
2011-04-26
- BFs with new DECAY.DEC for 281/pb: table
Old DECAY (K+ K- pi+):
Alias myphip phi
#
Alias myanti-K*0p anti-K*0
#
Decay myD+
0.003437   myphip pi+                       SVS;
0.002796   myanti-K*0p  K+                         SVS;
# Is 0.0087 too high?
0.0087   K+   K-  pi+                    PHSP;
Enddecay
#
Decay myphip
0.4910   K+   K-                         VSS;
Enddecay
#
Decay myanti-K*0p
0.6657      K-  pi+                        VSS;
Enddecay
New DECAY:
Alias myanti-K*0p anti-K*0
Alias myanti-K_0*0p anti-K_0*0
Alias myf_0p f_0
Alias myf_2p f_2
#
Decay myD+
0.00366685  myanti-K_0*0p K+                     PHSP;
0.0031915  myphip pi+                         SVS;
0.00299565  myanti-K*0p  K+                    SVS;
0.0001   K+   K-  pi+                    PHSP;
0.000044 myf_0p pi+                              PHSP;
0.0000184        myf_2p pi+                              STS;
Enddecay
#
Decay myphip
0.4910   K+   K-                         VSS;
Enddecay
#
Decay myanti-K*0p
0.6657      K-  pi+                        VSS;
Enddecay
#
Decay myanti-K_0*0p
0.6667      K-  pi+                       PHSP;
Enddecay
#
Decay myf_0p
0.1100   K+   K-                         PHSP;
Enddecay
#
Decay myf_2p
0.0230   K+   K-                         TSS;
Enddecay
#
2011-04-12
- External backgrounds - D+ to multipions
Las week: Get the raw sideband yield for 281/pb in the new env:
Mode 281ipbv0 (CBX) 281ipbv7 Delta Ks pi 172 +/- 14 404 +/- 36 +135% (16σ) Ks pi pi0 670 +/- 46 1096 +/- 125 +64% (9σ) Ks pi pi pi 888 +/- 62 864 +/- 78 -3% (0.4σ) Fix the shape of core Gaussian for the Kspi, and Kspipipi modes:
Mode 281ipbv0 (Fitting) 281ipbv7 (fixed) Delta Ks pi 183 +/- 20 183 +/- 20 +0 (0σ) Ks pi pi0 686 +/- 64 705 +/- 74 +2.8% (0.3σ) Ks pi pi pi 863 +/- 88 805 +/- 69 -6.7% (0.6σ) Use the same technique for the full data sample:
Mode 281/pb 281/pb * 2.91 818/pb Delta (%) Ks pi 183 532.53 495 -7.05 Ks pi pi0 686 1996.26 2072 3.79 Ks pi pi pi 863 2511.33 2438 -2.92 
Mode Bkgs 281/pb 281/pb X 2.91 Bkgs 818/pb Delta (%) Ks pi 81 235.71 221 -6.24 Ks pi pi0 220 640.2 552 -13.78 Ks pi pi pi 117 340.47 338 -0.73 - Update the BFs (818ipbv11)
Compare with last one : table
Compare with Lake Louise Results (818ipbv8): table
- Updating the BFs for Generic MC
Need to get the generated number of single and double tags in the generic MC in order to calculate the efficiency.
2011-04-05
- External backgrounds - D+ to multipions
Previous:
Mode Bkgs 281/pb 281/pb X 2.91 Bkgs 818/pb Delta Ks pi 81 235.71 372 0.36637097 Ks pi pi0 220 640.2 1405 0.54434164 Ks pi pi pi 117 340.47 338 -7.3076923e-3 Compare the raw sideband yield from data for 281/pb and 818/pb:
Mode 281/pb 281/pb * 2.91 818/pb Delta Ks pi 172 501 643 0.28 Ks pi pi0 670 1950 2891 0.48 Ks pi pi pi 888 2584 2645 0.02 Get the raw sideband yield for 281/pb in the new env:
Mode 281ipbv0 281ipbv7 Delta Ks pi 172 +/- 14 404 +/- 36 +135% (16σ) Ks pi pi0 670 +/- 46 1096 +/- 125 +64% (9σ) Ks pi pi pi 888 +/- 62 864 +/- 78 -3% (0.4σ) Ks mass distribution for data: figure (281ipbv0), figure (281ipbv7)
2011-03-29
- Multiple candidate rate
Previous:


Fixed by using the Generic MC:

- External backgrounds - D+ to multipions
Previous:


Fixed error: (should use signal MC, but used data)

Update the absolute backgrounds:


Mode Bkgs 281/pb 281/pb X 2.91 Bkgs 818/pb Delta Ks pi 81 235.71 372 0.36637097 Ks pi pi0 220 640.2 1405 0.54434164 Ks pi pi pi 117 340.47 338 -7.3076923e-3 - Update the BFs (818ipbv10)
Compare with Lake Louise Results (818ipbv8): table
2011-03-22
- Multiple candidate rate
- 281/pb:
- 818/pb:
- 281/pb:
- Question: How to assign the error?
A: Used the smaller one from (FMC - Fdata) or Delta e/eMC
Todo: Check the FMC in the procedure, use Generic MC which have more fakes.
- External backgrounds - D+ to multipions


Done:
- Question: How to get the Ebkg ?
A: Generate the multipion samples and calculate.
2011-03-15
- Reproduced the mutiplicity results: largest error (0.62% to
0.50%), still ignorable.
Stated with the same "3-sigma" table.
- Processing the multiple candidate rate study.
Have split the sample into single and mutiple candidate, fits OK with all data, but have problem in some signal MC modes.
Investigating mode D0 to Kpipi0:
Compared the mBC distribution with original sample (281ipbv0):
- mBC distribution for signal MC (D0 to Kpipi0), compare with
281ipbv0: figure
Notice the shift.
Check the other modes, check the beam energy shifts.
- mBC distribution for signal MC (D0 to Kpipi0), compare with
281ipbv0: figure
2011-03-08
- Questions on CBX from Committee:
- More digits for the BFs … done.
- About the lineshape parameters:
Sec. 6.1.3 says, mψ(3770) = 3.7724 GeV; Γψ(3770) = 25.2 MeV; R
= 12.7 GeV−1, while sec. 8.2 says 3.7718 GeV; 28.6 MeV; 12.3
GeV−1. I assume the first is what was used, while the second
is a remnant. Is this right? If so, why the change from the
281 analysis?  Also, if so, this is even further from BES's
(no longer "recent") measurements.  Perhaps this choice needs
to be better explained--there is sufficient discussion of the
correlation between mass and width, but I didn't get why any
particular combination was chosen (the figure didn't help me,
anyway). Also, what was the basis for the choice (and change
in choice) of R?
The PID of ψ(3770) have been changed in the
evt.pdl:CLEO 2005 CLEO 2008 PDG 2010 ψ(3770) mass (GeV) 3.7699 3.7724 3.7729 ψ(3770) width (MeV) 23.6 25.2 27.3 For the mass of ψ(3770), we used 3771.8 MeV in the 281/pb analysis, because our energy scale has been shifted by 0.6 MeV. In the 818/pb version, this shift has been corrected in the pass2 process. (right?)
Not sure why we have 25.2 MeV for the width.?
And R change from 12.3 to 12.7 ?
- Compare the 281/pb and 537/pb data yields


- SQRT scale plot OK. (Thanks to Peter! )
- Todo: Add (check) digits to ST, DT tables.
2011-03-01
- Define goals for the CBX final version.
- Answer questions from committee.
- Add descriptions about what's new at the beginning of each section.
- Backgrounds, systematic, etc.
- Think about the difference for the kpipi0 mode.
- Use Peter's ROOT version to plot the sqrt.
- When shall we work on the paper, and which journal (PRD?)
- Finish the body of thesis by the end of March
2011-02-08
- Preliminary BF results using the updated systematics (818ipbv8)
- Updated items:
- ST Background modeling
- Delta E requirement
- Signal lineshape
- FSR
- Trigger
- K/pi tracking
- pi0 efficiency
- Double DCSD corrections
- Compare with last version (818ipbv7, used 281/pb systematics) => table
- Compare with 281/pb result => table
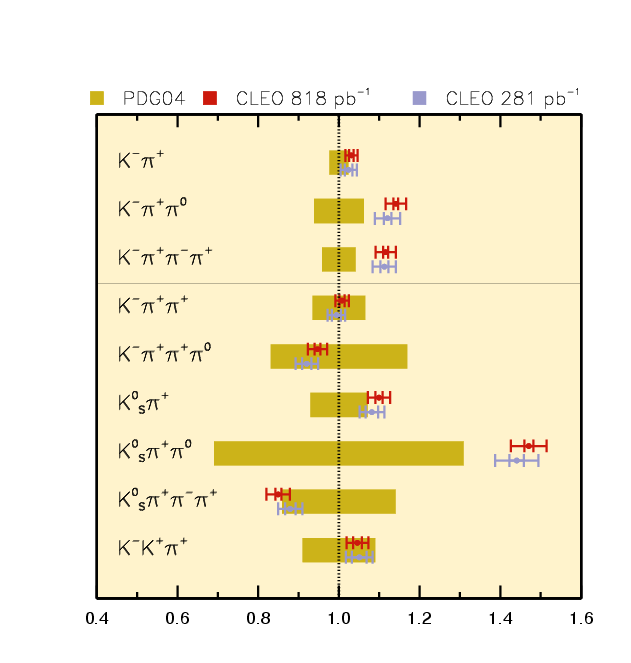
- Compare the PDG04, 281/pb, and 818/pb => figure
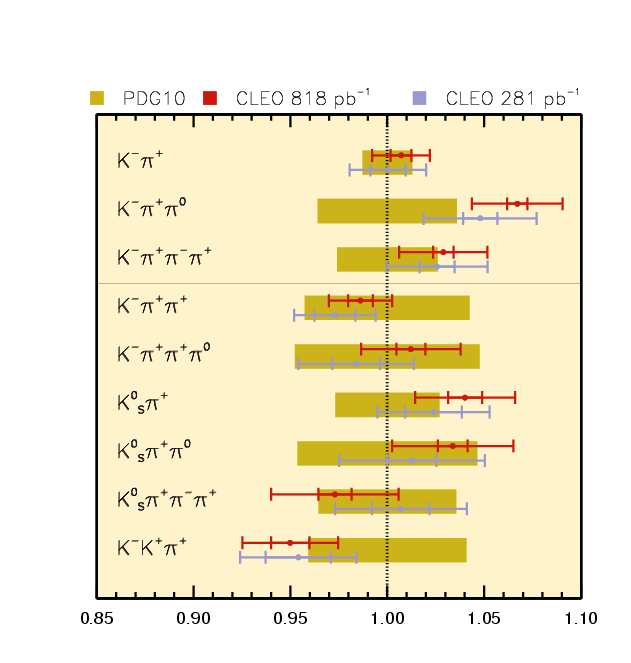
- Compare the PDG2010, 281/pb, and 818/pb => figure
- Updated items:
- Resulst with imaginary best senario (818ipbv9)
- Improve all of the syst in 'ST Background modeling'.
Mode 281/pb 818ipbv8 818ipbv9 (Imaginary) Kpi 0.4 0.59 0.4 Kpipi0 1.0 1.2 1.0 Kpipipi 0.4 0.64 0.4 Kpipi 0.4 0.41 0.41 Kpipipi0 1.5 3.31 1.0 Kspi 0.4 0.91 0.3 Kspipi0 1.0 1.46 1.0 Kspipipi 1.0 1.24 1.0 KKpi 1.0 0.80 0.8
- Improve all of the syst in 'ST Background modeling'.
- Compare with 818ipbv8 => table
- Compare with 281/pb => table
- Todo:
- Check the difference calculation.
- Provide David for the txt file.
- Prepare the slides in next two days.
2011-02-01
- Update on Substructure syst.
Fixed the bug in applying the efficiency correction on two pions, now the uncertainty is in the same level as before, dominated by the Kaon effect.
Last week:

After fix:

Compare with previous value:
Mode 281/pb 818/pb (old) 818/pb (new) Kpipipi 1.2 5.96 1.21 Checked the KKpi procedure, found no obvious problem there.
- Questions on multiplicity study


- Todo: Move on using the previous multiplicity study result and get the preliminary result for BFs first.
2011-01-25
- Update on Substructure syst.
- Calculate uncertainties for each mode:
- Compare with the 281/pb analysis
Mode 281/pb (%) 818/pb (%) Kpipi0 0.3 0.52 Kpipipi 1.2 5.96 Kpipi 0.6 0.52 Kpipipi0 0.5 0.91 Kspipi0 1.2 0.78 Kspipipi 0.5 0.61 KKpi 1.3 1.85 Trouble modes: D0 → K- pi+ pi+ pi- and D+ → K+ K- pi+.
- Compare the daughters' momentum:
- D0 → K- pi+ pi+ pi-:


- D+ → K+ K- pi+


- D0 → K- pi+ pi+ pi-:
- Noticed big shifts in K momentum in D0 → K- pi+ pi+ pi-:
New Original 

- Parsed the Decay info for the two MC:
D0 → K- pi+ pi+ pi-:
- Calculate uncertainties for each mode:
20050525_MCGEN/data/DECAY.DEC        20080624_MCGEN/data/DECAY.DEC
Parent particle? D0                  Final state? K- pi+ pi+ pi-
Final state? K- pi+ pi+ pi-          Total 0.077048600879
0.035916 Chain:                      0.0369 Chain:
        D0 -> a_1+ K-                        D0 -> a_1+ K-
        a_1+ -> pi+ rho0                     a_1+ -> pi+ rho0
        rho0 -> pi+ pi-                      rho0 -> pi+ pi-
0.01497825 Chain:                    0.0159 Chain:
        D0 -> anti-K*0 pi+ pi-               D0 -> K- pi+ rho0
        anti-K*0 -> K- pi+                   rho0 -> pi+ pi-
0.00971922 Chain:                    0.0099855 Chain:
        D0 -> anti-K*0 rho0                  D0 -> anti-K*0 rho0
        anti-K*0 -> K- pi+                   anti-K*0 -> K- pi+
        rho0 -> pi+ pi-                      rho0 -> pi+ pi-
0.0074 Chain:                        0.0055 Chain:
        D0 -> K- pi+ pi+ pi-                 D0 -> K- pi+ pi+ pi-
0.006 Chain:                         0.00412734 Chain:
        D0 -> K- pi+ rho0                    D0 -> anti-K*0 pi+ pi-
        rho0 -> pi+ pi-                      anti-K*0 -> K- pi+
0.00154508 Chain:                    0.00160284 Chain:
        D0 -> K_1- pi+                       D0 -> K_1- pi+
        K_1- -> K- pi+ pi-                   K_1- -> K- pi+ pi-
0.001498 Chain:                      0.001554 Chain:
        D0 -> K_1- pi+                       D0 -> K_1- pi+
        K_1- -> K- rho0                      K_1- -> K- rho0
        rho0 -> pi+ pi-                      rho0 -> pi+ pi-
0.000760023033 Chain:                0.000788435109 Chain:
        D0 -> K_1- pi+                       D0 -> K_1- pi+
        K_1- -> anti-K*0 pi-                 K_1- -> anti-K*0 pi-
        anti-K*0 -> K- pi+                   anti-K*0 -> K- pi+
0.00066963 Chain:                    0.00050167 Chain:
        D0 -> K- omega pi+                   D0 -> K- omega pi+
        omega -> pi+ pi-                     omega -> pi+ pi-
0.00016183167 Chain:                 0.00016183167 Chain:
        D0 -> anti-K*0 omega                 D0 -> anti-K*0 omega
        anti-K*0 -> K- pi+                   anti-K*0 -> K- pi+
        omega -> pi+ pi-                     omega -> pi+ pi-
2.60117e-05 Chain:                   2.69841e-05 Chain:
        D0 -> K_1- pi+                       D0 -> K_1- pi+
        K_1- -> K- omega                     K_1- -> K- omega
        omega -> pi+ pi-                     omega -> pi+ pi-
Checked the evt.pdl:
a1+ is not changed.
rho0 has changed its madd from 0.7685 to 0.7755 (0.91%). This may account for the difference.
For D+ → K+ K- pi+:
20050525_MCGEN/data/DECAY.DEC             20080624_MCGEN/data/DECAY.DEC
Parent particle? D+                       Parent particle? D+
Final state? K+ K- pi+                    Final state? K+ K- pi+
0.0087 Chain:                             Total 0.0100164
        D+ -> K+ K- pi+                   0.00366685 Chain:
0.003437 Chain:                                   D+ -> anti-K_0*0 K+
        D+ -> phi pi+                             anti-K_0*0 -> K- pi+
        phi -> K+ K-                      0.0031915 Chain:
0.00279594 Chain:                                 D+ -> phi pi+
        D+ -> K+ anti-K*0                         phi -> K+ K-
        anti-K*0 -> K- pi+                0.00299565 Chain:
                                                  D+ -> K+ anti-K*0
                                                  anti-K*0 -> K- pi+
                                          0.0001 Chain:
                                                  D+ -> K+ K- pi+
                                          4.4e-05 Chain:
                                                  D+ -> f_0 pi+
                                                  f_0 -> K+ K-
                                          1.84e-05 Chain:
                                                  D+ -> f_2 pi+
                                                  f_2 -> K+ K-
Now, the question is how to correct this difference?
Todo: Check the correction for pions in k3pi mode.
2011-01-18
- Updated the FSR Systmatics. Used 25% as suggested by HFAG.

- Progress on Substructure syst.
I'm not sure how to get the "effective overall efficiencies". To be specific, I suppose the top row in Figure 4 are signal MC, and bottom row are generic MC / data comparison. Following your script at :
/nfs/cor/user/ponyisi/hadD/summerconf/kpipi0/
I can produce the plots, but wondering about where to get the final number (0.3% in this case).
- Practice talk schedule?
2011-01-11
- Progress on the sqrt scale plot
- Patched the SQRT code and the RooDLineShape in ROOT 5.28.
- Fit the signal MC for DtoKKpi

- Compare the original one:

Go with the plot only path. Send Peter details.
- Progress on the background shape systematics

Move on the the rest of the systematics.
2011-01-04
- Progress on Background Shape Systematics : fixing the D0toKpipipi0 mode.
- Progress on the SQRT scale plot
- Tried to use Peter's ROOT on reploting the existing root plot, but not work.
- Patched the code into the latest ROOT (v5.28), compiled OK.
- Working on the RooDLineShape into the new ROOT. (Check Name Space)